Exhibit 99.1
SUMMARY
The Combination of TopBuild and USI
We
are the leading purchaser, installer and distributor of insulation products to the United States construction industry based on revenue, with over 250 locations across 46 states. Our installation segment, TruTeam, is a leading provider of insulation
installation services. TruTeam handles every stage of the insulation process, including material procurement, project scheduling and logistics, multi-phase professional installation and installation quality assurance. Our distribution segment,
Service Partners, is a leading distributor of residential fiberglass insulation and insulation related products in the United States. We believe we have a leading national position within the insulation and distribution industries, as our footprint
currently covers 95% of all housing starts and places us in 99 of the top 100 metropolitan statistical areas, or MSAs, in the United States. For the twelve months ended December 31, 2017, we generated net sales and Adjusted EBITDA of
$1,906 million and $198 million, respectively.
On March 1, 2018, we entered into an Agreement and Plan of Merger to
acquire USI (excluding the construction services business) in an all-cash transaction valued at $475 million on a cash-free, debt-free basis. USI is a leading provider of insulation installation and
distribution services to the residential and commercial construction markets. USI has a diversified product and service offering, including fiberglass, spray foam and window and glass installation. USI has 38 locations in 13 states, including high
growth regions in the Pacific Northwest, Mountain West, Southwest and Southeast.
The USI Acquisition demonstrates the continued
successful execution of our business strategy. We believe the USI Acquisition will strengthen our position as the domestic leader in insulation installation and distribution by enhancing our scale, increasing our customer base, strengthening our
position in the supply chain, and diversifying our product offerings. For the twelve months ended December 31, 2017, on a pro forma basis after giving effect to the USI Acquisition, we would have generated combined net sales of
$2,268 million and pro forma Adjusted EBITDA of $259 million, including $15 million of expected synergies.
Combination Rationale
We believe that, following the USI Acquisition, our scale, geographic scope, and product diversification will be significantly
enhanced. The combined company will have a market-leading national installation and distribution platform positioned to deliver the best service to our customers. With significant operational alignment, and comparable
go-to-market strategies, we believe that the USI Acquisition also provides important synergy opportunities, which we expect to execute on within two years post-closing.
Strengthens TopBuild’s position as the leader in the insulation installation and distribution markets
We believe that we will be a market leader in the insulation installation and distribution markets. On a pro forma basis after giving effect
to the USI Acquisition, net sales for the twelve months ended December 31, 2017 would have been $2,268 million, with exposure to regions with more than 95% of residential housing starts
1
across 46 states. We believe that our expansive pro forma footprint will allow us to be the first choice for the industry’s leading homebuilders, and our ability to both install and
distribute allows us to provide value to various customer bases in differing market environments. We see opportunity for the implementation of best practices across the organization that will further enhance our ability to provide well-trained,
experienced operators delivering our value proposition to customers. In a market filled with independent contractors, our respected reputation, strong operating history, and stable, skilled labor force position us to be the first choice for our
customers.
Enhances geographic footprint and penetration in key growth markets
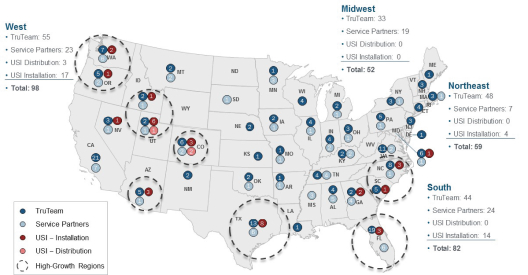
We believe that our expanded and augmented national platform will allow us to better serve our customers. The USI Acquisition broadens our
scale and geographic reach to over 290 facilities across 46 states. While we currently operate in all of the states covered by USI, the acquisition will increase our exposure to many of the higher-growth regions, including the Pacific Northwest,
Mountain West, Southwest, and Southeast regions of the United States.
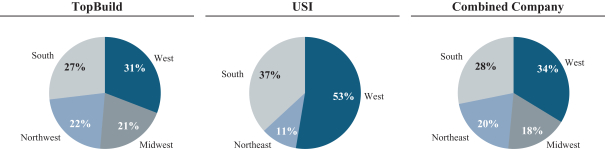
For the twelve months ended December 31, 2017, after giving
pro forma effect to the USI Acquisition, our geographic revenue would have been most exposed to the West region, including high-growth states such as Washington, Oregon, Utah, Colorado and Arizona. The USI Acquisition also increases our exposure to
the South, where USI has operations in North Carolina, South Carolina, Georgia, Florida and Texas.
Net Revenue by Geography for Twelve
Months Ended December 31, 2017
2
Combined National Footprint
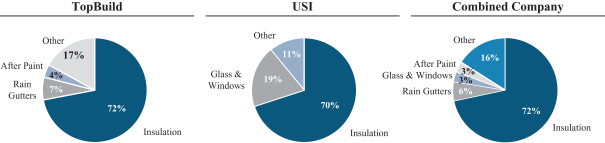
Diversifies business and product mix, enhancing value proposition for customers
We expect that the USI Acquisition will solidify our core insulation business while also expanding our product offerings. We believe that our
increased scale will support our positioning within the insulation value chain, allowing us to provide more attractive solutions to our customers. The acquisition also presents the opportunity to expand our
non-insulation product offerings. Our current offerings include rain gutters, garage doors, fireplaces, fireproofing, shower enclosures and mirrors. The USI Acquisition will expand our offerings to items such
as custom windows and doors and increase our offerings of shower enclosures and mirrors. We believe that we will have significant opportunities to cross-sell these products across our post-acquisition customer base.
Net Sales by End Market Exposure for Twelve Months Ended December 31, 2017
Accretive to TopBuild’s growth and margin profile; robust free cash flow generation supports ability to
deleverage quickly
We believe that the USI Acquisition will be highly complementary with the current financial profile of
TopBuild. For the twelve months ended December 31, 2017, on a pro forma basis after giving effect to the USI Acquisition, including the $15 million of synergies, our Adjusted EBITDA margin would have grown approximately 100 basis points.
On a pro forma basis for 2017, capital expenditures accounted for less than 2 % of revenue, aiding the strong free cash flow generation that has long been a TopBuild hallmark. We plan to continue to focus on driving efficiencies to support our
financial performance.
3
Attractive synergy opportunities within two years of close
We believe the USI Acquisition will result in approximately $15 million of run-rate cost
synergies two years after closing on an annual basis. We expect that these synergies will be realized at both the corporate and branch levels, as well as in our direct materials supply chain.
| |
• |
|
Corporate Synergies: Initiatives include corporate facility rationalization, elimination of redundant professional fees, headcount reductions, and other SG&A-level
costs, such as travel and entertainment. |
| |
• |
|
Branch Level Savings: primarily coming from location rationalization across at least 15 MSAs. We also see opportunities for savings through fleet reductions, general overhead reductions, and non-direct expenses including labor, business insurance, marketing and licensing costs. |
| |
• |
|
Supply Chain: savings on direct materials such as fiberglass, foam mineral wool, and cellulose. These savings are expected to be driven by our increased scale and buying power relative to USI, allowing us to
apply TopBuild’s historically lower material costs to USI’s supply needs. |
It is expected that synergies will be
phased in over the 24 months following close. We anticipate $5-10 million of savings within one year, with the balance being implemented by the end of year two. We estimate $12 million of one-time
costs in 2018 to achieve these identified synergies.
Optimal use of capital, delivering strong shareholder returns
We believe the synergies expected to be produced in this transaction will help drive returns. The USI Acquisition, we believe, will improve
our ability to consistently generate cash flow by realizing greater supply chain efficiencies and expanding our offerings and national footprint. Among other things, our ability to generate cash allows us to both reduce our debt and position
ourselves for future attractive investments.
TopBuild Overview
TopBuild Corp., headquartered in Daytona Beach, Florida, is the leading purchaser, installer, and distributor of insulation products to the
U.S. construction industry, with leading positions in key metropolitan markets. As of December 31, 2017, we operated over 250 locations across 46 states.
Prior to June 30, 2015, we operated as a subsidiary of Masco Corporation, which trades on the NYSE under the symbol “MAS.” We
were incorporated in Delaware in February 2015 as Masco SpinCo Corp., and we changed our name to TopBuild Corp. on March 20, 2015. On June 30, 2015, we separated from Masco, and on July 1, 2015, we began trading on the NYSE under the
symbol “BLD.”
We operate in two segments: our installation segment, TruTeam, and our distribution segment, Service Partners,
which we believe provides us with several distinct competitive advantages. We believe the combined buying power of our two businesses strengthens our ties to the national manufacturers of insulation and other building products, which helps ensure
that we are buying competitively and can maintain adequate material and supplies at our local branches and distribution centers. In addition, the overall effect drives efficiencies throughout our supply chain. Being a leader in both installation and
distribution allows us to effectively reach a broader set of builder customers, regardless of their size or geographic location in the United States.
Our installation segment, TruTeam, has over 175 installation branches located in 41 states across the nation. TruTeam handles every stage of
the insulation process, including material procurement, project
4
scheduling and logistics, multi-phase professional installation, and installation quality assurance. In addition to insulation products, we also install other building products including rain
gutters, fireproofing, garage doors, fireplaces, shower enclosures, and closet shelving. We also offer several services and tools designed to assist builders with applying principles of building science to new home construction through our Home
Services subsidiary and our Environments for Living® program. We believe that our diversified product offerings along with our relationships with contactors are key competitive advantages.
Our distribution segment, Service Partners, has over 70 distribution centers in 32 states across the nation. We distribute insulation and
other building products, including rain gutters, fireplaces, closet shelving, and roofing materials. We believe that our key differentiators are our national scale, stocking of recognized brands along with offering our customers less-than-truckload
(“LTL”) shipments, and same-day and next-day service.
Both our installation (64% of 2017 total sales) and distribution (36% of 2017 total sales) segments maintain a significantly diversified
customer base within the Residential3 (80% of 2017 total sales) and Commercial (20% of 2017 total sales) markets. Our TruTeam segment serves custom builders (34% of 2017 sales), national builders
(33% of 2017 sales), regional builders (20% of 2017 sales), and multi-family builders (12% of 2017 sales). Our business structure allows us to build customer relationships from the ground up. We rely heavily on our local branches to cultivate
builder relationships, regardless of their company size. Concurrently, our regional and national team members develop and sustain relationships with the larger builders to better serve them across their platforms. Our multi-faceted approach allows
us to engage and retain builders of all types. Our Service Partners segment has a customer base consisting of thousands of insulation contractors of all sizes, gutter contractors, weatherization contractors, other contractors, dealers, metal
building erectors, and modular home builders. We believe this diverse customer base reduces the impact of the inherent cyclicality in the homebuilding industry.
Our role in the market as one of the largest single purchasers of insulation has helped us maintain strong relationships with manufacturers of
insulation and other building product suppliers. This positioning helps ensure that we can purchase products at competitive prices, supply our local branches and distribution centers, and drive efficiencies throughout our supply chain.
Major Customers
We have a
diversified portfolio of customers, and no single customer accounted for 3% or more of our total sales for the twelve months ended December 31, 2017. Our top ten customers accounted for approximately 10% of our total sales in 2017. The USI
Acquisition will not only expand our customer base, but we believe that it will also increase our exposure to custom homebuilders, with whom USI has long-standing relationships and high estimated wallet share.
Suppliers
Our businesses depend
on our ability to obtain an adequate supply of high quality products and components from manufacturers and other suppliers. We rely heavily on third party suppliers for our products and key components. We source the majority of our building products
from four primary U.S.-based residential fiberglass insulation manufacturers: Knauf; CertainTeed; Johns Manville; and Owens Corning. Failure by our suppliers to provide us with an adequate supply of high quality products on commercially reasonable
terms, or to comply with applicable legal requirements, could have a material adverse effect on our financial condition and operating results. We believe we currently have positive relationships with our suppliers.
| 3 |
Includes repair and remodel end market. |
5
Employees
At December 31, 2017, we had approximately 8,400 employees. Approximately 700 of our employees are currently covered by collective
bargaining or similar labor agreements. The USI Acquisition will expand our labor headcount by more than 1,800 persons to over 10,200 employees.
USI
Overview
USI, headquartered in St. Paul, Minnesota, is a leading provider of insulation installation and distribution services to the
residential and commercial construction markets. USI (specifically, United Subcontractors, Inc.) was formed in 1998 and has grown both organically and through acquisitions over the years. Recent acquisitions include Cardalls Insulation (2015), Smith
Insulation (2015), Silver State Specialties (2015), IDS Specialty Building Products (2016), Southern Foam & Coatings (2016), Diamond Glass and Mirror (2017) and Glasshouse (2018). These acquisitions helped drive USI’s continued
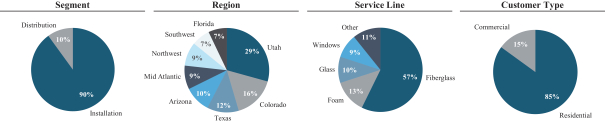
expansion across its geographical end markets, as well as continue to diversify its product offerings beyond traditional insulation services. Like TopBuild, USI operates in two segments: installation (90% of 2017 sales) and distribution (10% of 2017
sales). USI has a wide range of product offerings, including various fiber and foam insulation products, residential and commercial windows & glass products, as well as custom closets & shelving, residential garage doors, gutters,
and fireproofing & firestop. Currently, USI has over 1,800 employees at 38 locations in 13 states with significant presence in high-growth markets.
USI’s operations span 13 states and are located in high-growth states in the western and southern United States. Core markets for USI
include western states such as Colorado, Arizona, Utah, Washington and Oregon. Meanwhile, in the South, USI has a strong footprint in states including North Carolina, South Carolina, Georgia, Florida and Texas.
USI Net Sales for Twelve Months Ended December 31, 2017
Industry Overview
The national insulation market was estimated by Grand View Research to be approximately $13.6 billion in 2017 and expected to grow to
approximately $26.7 billion by 2025, at a CAGR of 8.8%. We participate in the residential new build and repair and remodel market, as well as the commercial market.
Insulation continues to play a vital role in the construction practice as the construction industry is trending towards more energy efficient,
sustainable designs. Production of fiberglass insulation products is largely confined to four primary U.S.-based residential fiberglass insulation manufacturers: Knauf; Owens Corning; Johns Manville; and CertainTeed. Insulation installers and
distributors play a pivotal role in the distribution of these manufacturers’ products. Installation and distribution companies provide a consistent, sizable source of demand, reducing the volatility of demand (and production) for manufacturers,
which generally allows the manufacturing process to continue uninterrupted, therefore reducing costly downtime. From the
6
construction standpoint, insulation installation is a pivotal point in the building process because it acts as a gateway for numerous processes to commence, such as Drywall, underlayment,
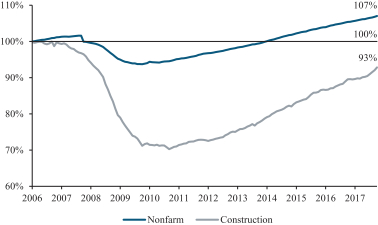
electrical, HVAC and interior design. Given the tight timelines of construction, a readily available supply of labor becomes imperative in maintaining the timeline, especially as residential construction timelines contract. Employment in the
construction sector was severely reduced during the recession and total employment in the sector remains below peak levels. The ability to retain and supply labor will continue to be an important focus point for installers and contractors alike.
In general, the insulation installation and distribution market’s growth is influenced by general economic cycles, as well as other
factors ranging from socioeconomic, demographic, and lifestyle changes to housing start projections. The shift to urban living that has given rise to multi-family housing starts, which use less insulation per unit, is now being countered by a
resurgence in single-family housing starts in recent years, with strong growth anticipated for 2018. We believe that an overall lack of housing supply along with the increasing age of the U.S. housing stock, currently with a median age of 37 years,
will provide support for growth in housing starts. In the coming years, we expect single-family construction growth to outperform the multi-family space.
Within the insulation market, changes in building codes coupled with evolving environmental and social dynamics have helped elevate the
importance of insulation. From an environmental sustainability standpoint, more insulation results in reduced energy consumption and lower electricity bills. The International Energy Conservation Code (“IECC”) 2012 and 2015 reports
proposed substantial increases in insulation density, which numerous states have adopted in their building codes. IECC resolutions have led to a reduction of energy use intensity of over 40% since the 1970s, with the bulk of the progress seen in the
2009, 2012, and 2015 IECC resolutions. Social, environmental, and economic rationale will continue to determine the development of stricter building codes and could favorably impact the insulation industry.
As a result of stricter building codes shifting consumer preferences, and product innovation, the spray foam insulation market has grown over
the past five years. By creating an air-tight, water resistant seal and offering superior insulating properties, spray foam helps builders adhere to stricter building codes and saves on energy costs. Whereas
spray foam was traditionally used only in custom, high-end homes due to price, the added cost over fiberglass has narrowed, paving the way for the product to be affordable for a larger portion of the market.
The insulation installation and distribution market is highly fragmented with independent regional and local insulation contractors that
are generally family-owned with annual sales of less than $10 million. We believe industry consolidation is driving further supply chain efficiencies and allows for more leveraging of best practices in an effort to deliver a consistent, best-in-class service.
7
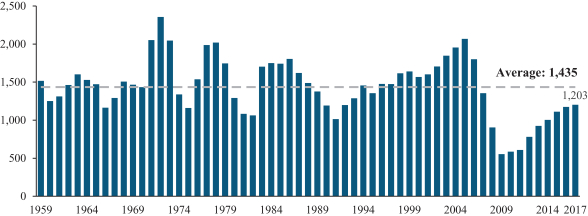
U.S. New Housing Starts (thousands)
U.S. Monthly Employment (Nonfarm vs. Construction) as Percent of Peak
Competitive Strengths
The market for the distribution and installation of building products is highly fragmented and competitive. Barriers to entry for local
competitors are relatively low, increasing the risk that additional competitors will emerge. Our ability to maintain our competitive position within our industry depends on a number of factors including our national scale, sales channels,
diversified product lines, strong local presence, and strong cash flows.
National scale. With our national footprint, we
provide products and services at all stages of the construction process within the United States. Our national scale, together with our centralized executive management team, allow us to compete locally by:
| |
• |
|
Providing national and regional builders with broad geographic reach, while maintaining consistent policies and practices that enable reliable, high-quality products and services across many geographies and building
sites; |
| |
• |
|
Establishing strong ties to major manufacturers of insulation and other building products, which helps ensure that we buy competitively, maintain availability of supply to our local branches and distribution centers,
and drive efficiencies throughout our supply chain; |
8
| |
• |
|
Providing consistent, customized support and geographic coverage to our customers; |
| |
• |
|
Maintaining an operating capacity that allows us to ramp-up rapidly, without major incremental investment, to target forecasted growth in housing starts and construction activity in each of our lines of business
anywhere in the United States; and |
| |
• |
|
Leveraging investments in systems and processes and sharing best practices across both our installation and distribution segments. |
Two avenues to reach the builder. We believe that having both an installation and distribution business provides a number of
advantages to reach our customers and drive share gains. Our installation business customer base includes builders of all sizes. Our branches go to market with the local brands that small builders recognize and value, and we believe that our
national footprint is appealing to large builders who value consistency across a broad geography. Our distribution business focuses on selling to small contractors who are particularly adept at cultivating local relationships with small custom
builders. Being a leader in both installation and distribution allows us to more effectively reach a broader set of builder customers, regardless of their size or geographic location within the United States, as well as leverage housing growth
wherever it occurs.
Diversified lines of business. In response to the housing downturn in prior years, we enhanced our
ability to serve the commercial construction market. Although the commercial construction market is affected by many of the same macroeconomic and local economic factors that drive residential new construction, commercial construction has
historically followed different cycles than residential new construction. We believe that we have therefore positioned our business to benefit from a greater mix of commercial construction activity than we have historically, which we expect will
help reduce volatility due to reduced dependence on residential new construction while enabling us to better respond to changes in customer demand.
Strong local presence. Competition for the installation and sale of insulation and other building products to builders occurs in
localized geographic markets throughout the country. Builders in each local market have different choices among insulation installers and distributors for their projects, and most builders generally value local relationships, quality, and
timeliness. Our installation branches are locally-branded businesses that are recognized within the communities in which they operate. Our distribution centers service primarily local contractors, lumberyards, retail stores and others who, in turn,
service local homebuilders and other customers. Our operating model, in which individual branches and distribution centers maintain local customer relationships, enables us to develop local, long-tenured relationships with these customers, build
local reputations for quality, service and timeliness, and provide specialized products and personalized services tailored to a geographic region. At the same time, our local operations benefit from centralized functions such as information
technology, credit and purchasing, and the resources and scale efficiencies of an installation and distribution business that has a presence across the United States.
Reduced exposure to residential housing cyclicality. During industry downturns many insulation contractors, who typically buy
directly from manufacturers during industry peaks, return to purchasing through distributors for small, LTL shipments, reducing warehousing needs, and requiring access to purchases on credit. We believe that this drives incremental customers to
Service Partners during these downturns in the business cycle, offsetting decreases at TruTeam as a result of a downturn. Our leadership position in both installation and distribution helps to reduce exposure to cyclical swings in our lines of
business.
Strong cash flow, low capital investment, and favorable working capital fund organic growth. Over the last
several years, we have reduced fixed costs and improved our labor utilization. As a result, we can achieve profitability at lower levels of demand as compared to historical periods. For further discussion on our cash flows and liquidity, see
“Management’s Discussion and Analysis of Financial Condition and Results of Operations of TopBuild Corp.—Liquidity and Capital Resources”.
9
Business Strategy
Maximizing opportunities related to favorable macro drivers. We believe that we are well positioned to capitalize on the
positive macro trends in both the residential and commercial markets. While still a tight labor market, construction hiring has improved in recent years with increased activity, as has commercial and residential construction spending. Housing starts
have recovered significantly since the downturn; however, current starts remain below the 20-year average, indicating there is still opportunity for significant growth. The U.S. Bureau of Census expects
housing starts to grow between 8% and 10% in 2018, and the national ratio of jobs creation to single family home construction is nearly double the long-term average. Commercial starts have grown at double digit rates in recent years and are expected
to continue to grow at this rate in the near term.
Leverage national scale to increase market share organically and through
acquisitions. Between TruTeam and Service Partners, we have the largest network of branches in the United States, with 290+ pro forma locations servicing over 50,000 builders of all sizes nationwide. This scale, paired with our unique
operating model, gives us an advantage with smaller, local builders. Additionally, our localized presence helps us cultivate strong customer relationships and brand loyalty that enhances customer acquisition. We continue to make accretive and
strategic acquisitions a top priority. We look for targets that are complementary to our existing footprint, particularly in high growth regions, that augment our business product mix and capabilities, have a sustainable customer base, and provide
experienced entrepreneurial leaders. We successfully integrated six acquisitions in 2017, and we have completed two acquisitions to date in 2018. These deals were primarily self-sourced and generated through a local pipeline that remains robust.
Drive operational excellence throughout our company to expand margins. Exceptional labor and sales productivity within
TruTeam and seamless supply chain management within Service Partners are key drivers of our margin expansion. Operational efficiency in both segments optimizes our footprint starts and allows us to grow profitably. To adapt to market conditions, we
have added and consolidated branches, cut back on redundancies in work efforts, and concentrated workforces in areas of high demand. While we have executed upon operational initiatives in recent years, we believe that the USI Acquisition presents
new opportunities. We have currently identified $15 million of cost savings that we expect to realize within two years post-closing, and we expect that there is the opportunity to capture more. These synergies are driven by the significant
operational overlap between the two companies, as well as our ability to assume many of USI’s corporate-level responsibilities.
Combine our local relationships with our national resources. TruTeam and Service Partners each have a national reach across all
major MSAs but operate with a local focus. With our national resources, we can offer superior supply chain efficiencies to suppliers in exchange for volume discounts, as well as service national builders across multiple geographies. Simultaneously,
in both segments we exhibit localized knowledge, and we believe that we have optimal service capability and a reputable and well-known brand. The combination of our strong local relationships and national scale has led to the diversification of our
earnings base, as we service a full spectrum of customers and provide supply chain efficiencies to manufacturers of insulation and other products.
Continue product, end market and geographical diversification to mitigate cyclicality. While our core business is insulation, we
offer an extensive array of related products to help service customers of all sizes and needs. We have an established and visible presence across 46 states with many deep-rooted and strong customer relationships with builders of all sizes. The
geographic diversity in these relationships hedges against the potential impacts of losing customers during a cyclical downturn. In addition, during industry downturns, many insulation contractors who typically buy directly from manufacturers during
industry peaks return to purchasing through distributors for small, LTL shipments, reducing warehousing needs and requiring access to purchases on credit. Our ability to service these orders helped shield us from some of the impacts of the most
recent economic
10
downturn. To continue to help mitigate cyclicality, we have increased our exposure to the commercial end-market from 9% in 2005 to 30% in 2017, and we plan
to continue to diversify our end-market exposure in favor of the commercial market. The commercial market offers access to new customers and follows a different operating cycle than the residential market.
11
Summary Historical and Unaudited Pro Forma Financial Data of TopBuild Corp.
The following table presents summary historical and unaudited pro forma condensed consolidated financial data for the Company and its
subsidiaries. The historical financial data for the years ended December 31, 2015, December 31, 2016, and December 31, 2017 are derived from the Company’s audited financial statements. As the Transactions are being presented as
if they occurred at the Company’s fiscal year-end, only audited financial information is presented as part of the historical financial data.
The summary historical financial and other data do not reflect the completion of the Transactions or our capital structure following the
completion of the Transactions and are not indicative of results that would have been reported had the Transactions occurred as of the dates indicated. Data as of and for periods ending on December 31, 2017 or any prior date do not necessarily
reflect what our financial condition and results of operations would have been had we operated as a separate, stand-alone entity during such prior periods. This information is only summary and should be read in conjunction with the information
included in the section entitled “Risk Factors,” “Management’s Discussion and Analysis of Financial Condition and Results of Operations of TopBuild Corp.,” and the Company’s historical financial statements and the
related notes included elsewhere in this exhibit and the Company’s Annual Report on Form 10-K for the year ended December 31, 2017.
The following summary unaudited pro forma condensed consolidated financial information gives effect to the Transactions. The unaudited pro
forma condensed consolidated statement of operations for the period ended December 31, 2017 reflects the Transactions as if they had occurred on January 1, 2017. The unaudited pro forma condensed consolidated balance sheet as of
December 31, 2017 reflects the Transactions as if they had occurred on December 31, 2017. The pro forma adjustments are based on the information available at the time of the preparation of this exhibit.
The summary unaudited pro forma condensed consolidated financial information that follows is presented for informational purposes only and is
not intended to represent or be indicative of the consolidated results of operations or financial position that would have been reported had the Transactions been completed as of January 1, 2017 (with respect to the statement of operations
data), or as of December 31, 2017 (with respect to balance sheet data), and should not be taken as representative of our future consolidated results of operations or financial position had the Transactions occurred as of such dates. In
connection with the summary unaudited pro forma condensed consolidated financial information, we allocated the preliminary purchase price for the USI Acquisition to the acquired assets and liabilities based upon their estimated fair value. These
estimates are based on financial information available at the time of the preparation of this exhibit. Based on the timing of the closing of the Transactions and other factors, we cannot assure you that the actual adjustments will not differ
materially from the pro forma adjustments reflected in the summary unaudited pro forma combined financial information. It is expected that, following the consummation of the Transactions, we will incur
non-recurring expenses associated with the Transactions and integration of the operations of the two companies. These expenses and integration costs are not reflected in this summary unaudited pro forma
condensed consolidated financial information. Except where specified below, the summary unaudited pro forma condensed consolidated financial information also does not give effect to the potential impact of any anticipated synergies, operating
efficiencies or cost savings that may result from the Transactions.
12
Historical and Unaudited Pro Forma Statement of Operations Data:
|
|
|
|
|
|
|
|
|
|
|
|
|
|
|
|
|
| (dollars in thousands) |
|
Year ended
December 31,
2015 |
|
|
Year ended
December 31,
2016 |
|
|
Year ended
December 31,
2017 |
|
|
Year ended
December 31,
2017 |
|
| |
|
|
|
|
|
|
|
|
|
|
Unaudited
Pro Forma |
|
| Statement of Operations Data: |
|
|
|
|
|
|
|
|
|
|
|
|
|
|
|
|
| Net sales |
|
$ |
1,616,580 |
|
|
$ |
1,742,850 |
|
|
$ |
1,906,266 |
|
|
$ |
2,267,942 |
|
| Cost of sales |
|
|
1,258,551 |
|
|
|
1,342,506 |
|
|
|
1,445,157 |
|
|
|
1,710,697 |
|
|
|
|
|
|
|
|
|
|
|
|
|
|
|
|
|
|
| Gross profit |
|
|
358,029 |
|
|
|
400,344 |
|
|
|
461,109 |
|
|
|
557,245 |
|
|
|
|
|
|
| Operating expenses: |
|
|
|
|
|
|
|
|
|
|
|
|
|
|
|
|
| Selling, general and administrative |
|
|
274,498 |
|
|
|
278,740 |
|
|
|
294,245 |
|
|
|
378,274 |
|
| Significant legal settlement |
|
|
— |
|
|
|
— |
|
|
|
30,000 |
|
|
|
30,000 |
|
|
|
|
|
|
|
|
|
|
|
|
|
|
|
|
|
|
| Total operating expenses |
|
|
274,498 |
|
|
|
278,740 |
|
|
|
324,245 |
|
|
|
408,274 |
|
| Operating income |
|
|
83,531 |
|
|
|
121,604 |
|
|
|
136,864 |
|
|
|
148,971 |
|
| Other income (expense) net: |
|
|
|
|
|
|
|
|
|
|
|
|
|
|
|
|
| Interest expense: |
|
|
(9,465 |
) |
|
|
(5,608 |
) |
|
|
(8,019 |
) |
|
|
(30,942 |
) |
| Loss on extinguishment of debt |
|
|
— |
|
|
|
— |
|
|
|
(1,086 |
) |
|
|
(1,086 |
) |
| Other, net |
|
|
49 |
|
|
|
277 |
|
|
|
281 |
|
|
|
249 |
|
|
|
|
|
|
|
|
|
|
|
|
|
|
|
|
|
|
| Other expense (net) |
|
|
(9,416 |
) |
|
|
(5,331 |
) |
|
|
(8,824 |
) |
|
|
(31,779 |
) |
| Income before provision for income taxes |
|
|
74,115 |
|
|
|
116,273 |
|
|
|
128,040 |
|
|
|
117,191 |
|
| Provision for income taxes |
|
|
5,008 |
|
|
|
(43,667 |
) |
|
|
30,093 |
|
|
|
45,004 |
|
|
|
|
|
|
|
|
|
|
|
|
|
|
|
|
|
|
| Net income attributable to continuing operations |
|
$ |
79,123 |
|
|
$ |
72,606 |
|
|
$ |
158,133 |
|
|
$ |
162,195 |
|
|
|
|
|
|
|
|
|
|
|
|
|
|
|
|
|
|
| Loss from discontinued operations, net |
|
$ |
(152 |
) |
|
$ |
— |
|
|
$ |
— |
|
|
|
— |
|
|
|
|
|
|
|
|
|
|
|
|
|
|
|
|
|
|
| Net income |
|
$ |
78,971 |
|
|
$ |
72,606 |
|
|
$ |
158,133 |
|
|
$ |
162,195 |
|
|
|
|
|
|
|
|
|
|
|
|
|
|
|
|
|
|
Historical and Unaudited Pro Forma Balance Sheet Data:
|
|
|
|
|
|
|
|
|
|
|
|
|
| (dollars in thousands) |
|
Year ended
December 31,
2016 |
|
|
Year ended
December 31,
2017 |
|
|
Year ended
December 31,
2017 |
|
| |
|
|
|
|
|
|
|
Unaudited Pro
Forma |
|
| Balance Sheet Data (at end of period): |
|
|
|
|
|
|
|
|
|
|
|
|
| Cash and cash equivalents |
|
$ |
134,375 |
|
|
$ |
56,521 |
|
|
$ |
38,551 |
|
| Property and equipment, net |
|
|
92,760 |
|
|
|
107,121 |
|
|
|
139,569 |
|
| Total assets |
|
|
1,690,119 |
|
|
|
1,749,549 |
|
|
|
2,305,036 |
|
| Total liabilities |
|
|
717,572 |
|
|
|
753,030 |
|
|
|
1,319,397 |
|
| Equity |
|
|
972,547 |
|
|
|
996,519 |
|
|
|
985,639 |
|
13
|
|
|
|
|
|
|
|
|
|
|
|
|
|
|
|
|
| (dollars in thousands) |
|
Year ended
December 31,
2015 |
|
|
Year ended
December 31,
2016 |
|
|
Year ended
December 31,
2017 |
|
|
Year ended
December 31,
2017 |
|
| |
|
|
|
|
|
|
|
|
|
|
Unaudited Pro
Forma |
|
| Other Historical and Unaudited Pro Forma Selected Data: |
|
|
|
|
|
|
|
|
|
|
|
|
|
|
|
|
| EBITDA(1) |
|
$ |
95,487 |
|
|
$ |
133,615 |
|
|
$ |
152,231 |
|
|
$ |
188,431 |
|
| Adjusted EBITDA(1) |
|
|
107,452 |
|
|
|
144,547 |
|
|
|
197,602 |
|
|
$ |
259,334 |
|
| Adjusted EBITDA Margin(1) |
|
|
6.6 |
% |
|
|
8.3 |
% |
|
|
10.4 |
% |
|
|
11.4 |
% |
| Gross Profit |
|
|
358,029 |
|
|
|
400,344 |
|
|
|
461,109 |
|
|
$ |
557,245 |
|
| Gross Profit Margin |
|
|
22.1 |
% |
|
|
23.0 |
% |
|
|
24.2 |
% |
|
|
24.6 |
% |
| Long-term debt |
|
|
|
|
|
|
|
|
|
|
|
|
|
$ |
692,297 |
|
| Long-term debt to Adjusted EBITDA |
|
|
|
|
|
|
|
|
|
|
|
|
|
|
2.7x |
|
| (1) |
In addition to net income determined in accordance with GAAP, we evaluate our operating performance using EBITDA, Adjusted EBITDA, and Adjusted EBITDA Margin. For a description of our use of these non-GAAP financial metrics and their limitations as tools of evaluation, see “Non-GAAP Financial Information.” |
We define EBITDA as net income adjusted for interest expense, net, provision (benefit) for income taxes and depreciation and amortization.
Adjusted EBITDA represents EBITDA as further adjusted for the line items listed in the table below.
|
|
|
|
|
|
|
|
|
|
|
|
|
|
|
|
|
| (dollars in thousands) |
|
Year ended
December 31,
2015 |
|
|
Year ended
December 31,
2016 |
|
|
Year ended
December 31,
2017 |
|
|
Year ended
December 31,
2017 |
|
| |
|
|
|
|
|
|
|
|
|
|
Unaudited Pro
Forma |
|
| Net income, as reported |
|
$ |
78,971 |
|
|
$ |
72,606 |
|
|
$ |
158,133 |
|
|
$ |
162,195 |
|
| Depreciation & amortization |
|
|
12,108 |
|
|
|
12,011 |
|
|
|
16,453 |
|
|
|
40,578 |
|
| Provision for income taxes |
|
|
(5,008 |
) |
|
|
43,667 |
|
|
|
(30,093 |
) |
|
|
(45,004 |
) |
| Interest expense and other, net |
|
|
9,416 |
|
|
|
5,331 |
|
|
|
7,738 |
|
|
|
30,661 |
|
|
|
|
|
|
|
|
|
|
|
|
|
|
|
|
|
|
| EBITDA |
|
|
95,487 |
|
|
|
133,615 |
|
|
|
152,231 |
|
|
|
188,431 |
|
| Share-based compensation(a) |
|
|
4,651 |
|
|
|
7,669 |
|
|
|
9,274 |
|
|
|
9,274 |
|
| Significant legal settlement(b) |
|
|
2,430 |
|
|
|
— |
|
|
|
30,000 |
|
|
|
30,000 |
|
| Rationalization charges(c) |
|
|
4,672 |
|
|
|
3,139 |
|
|
|
3,755 |
|
|
|
3,755 |
|
| Loss on extinguishment of debt(d) |
|
|
— |
|
|
|
— |
|
|
|
1,086 |
|
|
|
1,086 |
|
| Acquisition related costs(e) |
|
|
— |
|
|
|
124 |
|
|
|
1,256 |
|
|
|
3,672 |
|
| Other(f) |
|
|
212 |
|
|
|
— |
|
|
|
— |
|
|
|
4,772 |
|
| Glasshouse(g) |
|
|
— |
|
|
|
— |
|
|
|
— |
|
|
|
3,344 |
|
| Estimated Synergies(h) |
|
|
— |
|
|
|
— |
|
|
|
— |
|
|
|
15,000 |
|
|
|
|
|
|
|
|
|
|
|
|
|
|
|
|
|
|
| Adjusted EBITDA |
|
$ |
107,452 |
|
|
$ |
144,547 |
|
|
$ |
197,602 |
|
|
$ |
259,334 |
|
|
|
|
|
|
|
|
|
|
|
|
|
|
|
|
|
|
| (a) |
Principally includes stock-based compensation. |
| (b) |
Significant legal settlements occurred in 2015 relating to workers compensation and general insurance claims. A significant legal settlement occurred in 2017 relating to the settlement of a breach of contract action due
to our termination of an insulation supply agreement with Owens Corning. |
| (c) |
Includes compensation associated with eliminated headcount and other restructuring activities. |
| (d) |
A loss on the extinguishment of debt relating to the Credit Agreement. |
14
| (e) |
Costs related to six acquisitions completed in 2017 and one acquisition completed in 2016. In 2017, acquisitions were completed for substantially all the assets of Midwest, EcoFoam, MR Insulfoam, Capital, Superior, and
Canyon. In 2016, the acquisition of substantially all the assets of Valley was completed. |
| (f) |
Consists of estimated results for 2017 with respect to acquisitions by USI, net of results for discontinued operations for 2017. Additionally contains management’s estimated adjustments for 2017 with respect
to expenses not expected to recur in subsequent periods (including, among other things, consulting expenses, board fees, recruiting expenses, transaction expenses and weather-related impacts, including with respect to hurricanes Harvey and Irma).
|
| (g) |
Represents estimated, unaudited results in 2017 for Glasshouse, an entity acquired by USI, prior to its date of acquisition. |
| (h) |
Represents synergies that we expect to realize over time from the acquisition. We will incur significant cash costs in the next twelve months to realize these synergies, and will not fully realize the synergies for
several years. Actual synergies could vary materially from our estimate. |
15
Risks Related to the USI Acquisition
We may not be able to successfully integrate USI and other businesses that we may acquire in the future.
Our ability to successfully implement our business plan and achieve targeted financial results is dependent on our ability to successfully
integrate USI and other businesses that we may acquire in the future. The process of integrating USI, and any other acquired businesses, involves risks. These risks include, but are not limited to:
| |
• |
|
demands on management related to the increase in the size of our business; |
| |
• |
|
diversion of management’s attention from the management of daily operations; |
| |
• |
|
difficulties in the assimilation of different corporate cultures and business practices; |
| |
• |
|
difficulties in conforming the acquired company’s accounting policies to ours; |
| |
• |
|
retaining employees who may be vital to the integration of departments, information technology systems, including accounting systems, technologies, books and records, and procedures, and maintaining uniform standards,
such as internal accounting controls, procedures, and policies; and |
| |
• |
|
costs and expenses associated with any undisclosed or potential liabilities. |
Failure to
successfully integrate USI, or any other acquired businesses, may result in reduced levels of revenue, earnings, or operating efficiency than might have been achieved if we had not acquired such businesses.
In addition, the USI Acquisition will result, and any future acquisitions could result, in the incurrence of additional debt and related
interest expense, contingent liabilities, and amortization expenses related to intangible assets, which could have a material adverse effect on our financial condition, operating results, and cash flow.
We may not be able to achieve the benefits that we expect to realize as a result of the USI Acquisition. Failure to achieve such benefits could have an
adverse effect on our financial condition and results of operations.
We may not be able to realize anticipated cost savings,
revenue enhancements, or other synergies from the USI Acquisition, either in the amount or within the time frame that we expect. In addition, the costs of achieving these benefits may be higher than, and the timing may differ from, what we expect.
Our ability to realize anticipated cost savings, synergies, and revenue enhancements may be affected by a number of factors, including, but not limited to, the following:
| |
• |
|
the use of more cash or other financial resources on integration and implementation activities than we expect; |
16
| |
• |
|
unanticipated increases in expenses unrelated to the USI Acquisition, which may offset the expected cost savings and other synergies from the USI Acquisition; |
| |
• |
|
our ability to eliminate duplicative back office overhead and redundant selling, general, and administrative functions; and |
| |
• |
|
our ability to avoid labor disruptions in connection with the integration of USI, particularly in connection with any headcount reduction. |
Specifically, while we expect the USI Acquisition to create significant opportunities to reduce our combined operating costs, these cost
savings reflect estimates and assumptions made by our management, and it is possible that our actual results will not reflect these estimates and assumptions within our anticipated timeframe or at all.
If we fail to realize anticipated cost savings, synergies, or revenue enhancements, our financial results may be adversely affected, and we
may not generate the cash flow from operations that we anticipate.
USI may have liabilities that are not known to us.
USI may have liabilities that we failed, or were unable, to discover in the course of performing our due diligence investigations of USI. We
cannot assure you that the indemnification available to us under the acquisition agreement in respect of the USI Acquisition or the representation and warranty insurance procured by us in connection with such agreement will be sufficient in amount,
scope or duration to fully offset the possible liabilities associated with USI’s business or property that we will assume upon consummation of the USI Acquisition. We may learn additional information about USI that materially adversely affects
us, such as unknown or contingent liabilities and liabilities related to compliance with applicable laws. Any such liabilities, individually or in the aggregate, could have a material adverse effect on our business, financial condition and results
of operation.
17
UNAUDITED PRO FORMA CONDENSED CONSOLIDATED FINANCIAL INFORMATION
The following unaudited pro forma condensed consolidated financial information is based on the historical audited consolidated
financial statements of TopBuild and USI appearing elsewhere in this exhibit and in the Company’s annual report on Form 10-K for the year ended December 31, 2017, as adjusted to illustrate the estimated pro forma effects of the Transactions.
The unaudited pro forma condensed consolidated financial information should be read in conjunction with the consolidated financial statements and related notes of TopBuild and USI and other financial information appearing elsewhere in this exhibit
and in the Company’s annual report on Form 10-K for the year ended December 31, 2017
The unaudited pro forma balance sheet gives
effect to the Transactions as if they had occurred on December 31, 2017. The unaudited pro forma statement of operations give effect to the Transactions as if they had occurred as of January 1, 2017.
The unaudited pro forma adjustments are based upon available information and certain assumptions that we believe are reasonable. The pro forma
adjustments and certain assumptions underlying these adjustments are described in the accompanying notes, which should be read in conjunction with the unaudited pro forma financial information. The pro forma adjustments are included only to the
extent they are (i) directly attributable to the Transactions, (ii) factually supportable and (iii) with respect to the pro forma statements of operations, expected to have a continuing impact on results. In addition, the unaudited
pro forma financial information has been compiled in accordance with the accounting policies of TopBuild as set out in the historical financial statements of TopBuild included in TopBuild’s annual report on Form 10-K for the year ended December
31, 2017.
Our acquisition of USI will be accounted for and is presented in the unaudited pro forma condensed consolidation financial
information as a purchase business combination in accordance with Accounting Standards Codification (“ASC”) 805, Business Combinations. Under ASC 805, the excess of the purchase price over the fair value of net assets acquired and
liabilities assumed is recorded as goodwill. The pro forma adjustments reflect our preliminary estimates of the purchase price allocation related to our acquisition of USI. However, as of the date of this exhibit, we have not performed the valuation
studies necessary to determine with any certainty the fair values of the assets that we will acquire and the liabilities that we will assume and the related allocation of purchase price. The purchase price allocation is subject to change based upon
finalization of appraisals and other valuation studies that we will arrange to obtain, and the amounts contained in the final purchase price allocation may differ materially from our preliminary estimates. For purposes of computing pro forma
adjustments, we have assumed that historical values of assets acquired and liabilities assumed reflect fair value. The pro forma balance sheet includes a preliminary estimate of fair value adjustments for property and equipment and identifiable
intangible assets such as tradenames and customer contracts, and the pro forma condensed consolidated statements of operations includes preliminary estimates of incremental depreciation and amortization expenses associated with the above described
fair value adjustments. However, these amounts are subject to change as we have not completed the appraisal process as of the date of this exhibit. The pro forma adjustments do not include adjustments to deferred tax assets or liabilities other than
with respect to USI’s historical goodwill and our preliminary estimate of the purchase price to be allocated to property and equipment and identifiable intangible assets and goodwill.
Revisions to the preliminary purchase price allocation, interest rates and financing costs could materially change the pro forma amounts of
total assets, total liabilities, invested equity, depreciation and amortization, interest expense and income tax expense presented herein. The structure of the Transactions and certain elections that we may make in connection with our acquisition of
USI and subsequent tax filings may impact the amount of deferred tax liabilities that are due and the realization of any deferred tax assets.
The unaudited pro forma condensed consolidated financial information contained in this exhibit is for informational purposes only and is not
intended to represent or be indicative of the consolidated results of operations or financial position that we would have reported had the Transactions been completed as of the dates presented and should not be taken as representative of our future
consolidated results of operations or financial position.
18
Condensed Consolidated Balance Sheet (Unaudited)
(dollars in thousands)
|
|
|
|
|
|
|
|
|
|
|
|
|
|
|
|
|
|
|
|
|
| |
|
As of
December 31, 2017 |
|
| |
|
Historical
TopBuild |
|
|
Historical
USI |
|
|
Acquisition
Adjustments
(a) |
|
|
Financing
Adjustments |
|
|
Pro Forma |
|
| ASSETS |
|
|
|
|
|
|
|
|
|
|
|
|
|
|
|
|
|
|
|
|
| Current assets: |
|
|
|
|
|
|
|
|
|
|
|
|
|
|
|
|
|
|
|
|
| Cash and cash equivalents |
|
$ |
56,521 |
|
|
$ |
18,167 |
|
|
$ |
(493,167 |
)(b) |
|
$ |
457,030 |
(b) |
|
$ |
38,551 |
|
| Receivables, net of an allowance for doubtful accounts of $3,673 and $3,374 at December 31,
2017, and December 31, 2016, respectively |
|
|
308,508 |
|
|
|
57,593 |
|
|
|
|
|
|
|
|
|
|
|
366,101 |
|
| Inventories, net |
|
|
131,342 |
|
|
|
15,605 |
|
|
|
|
|
|
|
|
|
|
|
146,947 |
|
| Prepaid expenses and other current assets |
|
|
15,221 |
|
|
|
3,291 |
|
|
|
|
|
|
|
|
|
|
|
18,512 |
|
|
|
|
|
|
|
|
|
|
|
|
|
|
|
|
|
|
|
|
|
|
| Total current assets |
|
|
511,592 |
|
|
|
94,656 |
|
|
|
(493,167 |
) |
|
|
457,030 |
|
|
|
570,111 |
|
| Property and equipment, net |
|
|
107,121 |
|
|
|
25,243 |
|
|
|
7,205 |
(a) |
|
|
|
|
|
|
139,569 |
|
| Goodwill |
|
|
1,077,186 |
|
|
|
160,623 |
|
|
|
80,391 |
(a) |
|
|
|
|
|
|
1,318,200 |
|
| Other intangible assets, net |
|
|
33,243 |
|
|
|
100,253 |
|
|
|
117,347 |
(a) |
|
|
|
|
|
|
250,843 |
|
| Deferred tax assets, net |
|
|
18,129 |
|
|
|
— |
|
|
|
4,540 |
(a) |
|
|
|
|
|
|
22,669 |
|
| Other assets |
|
|
2,278 |
|
|
|
1,366 |
|
|
|
|
|
|
|
|
|
|
|
3,644 |
|
|
|
|
|
|
|
|
|
|
|
|
|
|
|
|
|
|
|
|
|
|
| Total assets |
|
$ |
1,749,549 |
|
|
$ |
382,141 |
|
|
$ |
(283,684 |
) |
|
$ |
457,030 |
|
|
$ |
2,305,036 |
|
|
|
|
|
|
|
|
|
|
|
|
|
|
|
|
|
|
|
|
|
|
| LIABILITIES AND EQUITY |
|
|
|
|
|
|
|
|
|
|
|
|
|
|
|
|
|
|
|
|
| Current liabilities: |
|
|
|
|
|
|
|
|
|
|
|
|
|
|
|
|
|
|
|
|
| Accounts payable |
|
$ |
263,814 |
|
|
|
12,563 |
|
|
$ |
|
|
|
$ |
|
|
|
$ |
276,377 |
|
| Current portion of long-term debt |
|
|
12,500 |
|
|
|
1,200 |
|
|
|
(1,200 |
)(c) |
|
|
5,000 |
(c) |
|
|
17,500 |
|
| Accrued liabilities |
|
|
75,087 |
|
|
|
27,350 |
|
|
|
|
|
|
|
|
|
|
|
102,437 |
|
|
|
|
|
|
|
|
|
|
|
|
|
|
|
|
|
|
|
|
|
|
| Total current liabilities |
|
|
351,401 |
|
|
|
41,113 |
|
|
|
(1,200 |
) |
|
|
5,000 |
|
|
|
396,314 |
|
| Long-term debt |
|
|
229,387 |
|
|
|
118,294 |
|
|
|
(118,294 |
)(c) |
|
|
462,910 |
(c) |
|
|
692,297 |
|
| Deferred tax liabilities, net |
|
|
132,840 |
|
|
|
20,375 |
|
|
|
38,169 |
(d) |
|
|
|
|
|
|
191,384 |
|
| Long-term portion of insurance reserves |
|
|
36,160 |
|
|
|
— |
|
|
|
|
|
|
|
|
|
|
|
36,160 |
|
| Other liabilities |
|
|
3,242 |
|
|
|
— |
|
|
|
|
|
|
|
|
|
|
|
3,242 |
|
|
|
|
|
|
|
|
|
|
|
|
|
|
|
|
|
|
|
|
|
|
| Total liabilities |
|
|
753,030 |
|
|
|
179,782 |
|
|
|
(81,325 |
) |
|
|
467,910 |
|
|
|
1,319,397 |
|
|
|
|
|
|
|
|
|
|
|
|
|
|
|
|
|
|
|
|
|
|
| Commitments and contingencies |
|
|
|
|
|
|
|
|
|
|
|
|
|
|
|
|
|
|
|
|
| Equity |
|
|
|
|
|
|
|
|
|
|
|
|
|
|
|
|
|
|
|
|
| Preferred stock, $0.01 par value: 10,000,000 shares authorized; 0 shares issued and outstanding at
December 31, 2017, and December 31, 2016 |
|
|
— |
|
|
|
|
|
|
|
|
|
|
|
|
|
|
|
— |
|
| Common stock, $0.01 par value: 250,000,000 shares authorized; 38,626,378 issued and 35,586,916
outstanding at December 31, 2017, and 38,488,825 shares issued and 37,815,199 outstanding at December 31, 2016 |
|
|
386 |
|
|
|
|
|
|
|
|
|
|
|
|
|
|
|
386 |
|
| Treasury stock, 3,039,462 shares at December 31, 2017, and 673,626 shares at December 31,
2016, at cost |
|
|
(141,582 |
) |
|
|
|
|
|
|
|
|
|
|
|
|
|
|
(141,582 |
) |
| Additional paid-in capital |
|
|
830,600 |
|
|
|
202,359 |
|
|
|
(202,359 |
)(e) |
|
|
|
|
|
|
830,600 |
|
| Retained earnings |
|
|
307,115 |
|
|
|
|
|
|
|
|
|
|
|
(10,880 |
)(a)(h) |
|
|
296,235 |
|
|
|
|
|
|
|
|
|
|
|
|
|
|
|
|
|
|
|
|
|
|
| Total equity |
|
|
996,519 |
|
|
|
202,359 |
|
|
|
(202,359 |
) |
|
|
(10,880 |
) |
|
|
985,639 |
|
|
|
|
|
|
|
|
|
|
|
|
|
|
|
|
|
|
|
|
|
|
| Total liabilities and equity |
|
$ |
1,749,549 |
|
|
$ |
382,141 |
|
|
$ |
(283,684 |
) |
|
$ |
457,030 |
|
|
$ |
2,305,036 |
|
|
|
|
|
|
|
|
|
|
|
|
|
|
|
|
|
|
|
|
|
|
19
TopBuild Corp.
Condensed Consolidated Statement of Operations (Unaudited)
(in thousands, except common share amounts)
|
|
|
|
|
|
|
|
|
|
|
|
|
|
|
|
|
|
|
|
|
| |
|
Year Ended
December 31, 2017 |
|
| |
|
Historical
TopBuild |
|
|
Historical
USI |
|
|
Acquisition
Adjustments |
|
|
Financing
Adjustments |
|
|
Pro Forma |
|
| Net sales |
|
$ |
1,906,266 |
|
|
$ |
361,676 |
|
|
$ |
— |
|
|
$ |
— |
|
|
$ |
2,267,942 |
|
| Cost of sales |
|
|
1,445,157 |
|
|
|
271,102 |
|
|
|
(5,562 |
)(f) |
|
|
— |
|
|
|
1,710,697 |
|
|
|
|
|
|
|
|
|
|
|
|
|
|
|
|
|
|
|
|
|
|
| Gross profit |
|
|
461,109 |
|
|
|
90,574 |
|
|
|
5,562 |
|
|
|
— |
|
|
|
557,245 |
|
| Selling, general, and administrative expense (exclusive of significant legal settlement, shown
separately below) |
|
|
294,245 |
|
|
|
77,329 |
|
|
|
6,700 |
(f),(g) |
|
|
— |
|
|
|
378,274 |
|
| Significant legal settlement |
|
|
30,000 |
|
|
|
|
|
|
|
— |
|
|
|
— |
|
|
|
30,000 |
|
|
|
|
|
|
|
|
|
|
|
|
|
|
|
|
|
|
|
|
|
|
| Operating profit |
|
|
136,864 |
|
|
|
13,245 |
|
|
|
(1,138 |
) |
|
|
— |
|
|
|
148,971 |
|
| Other income (expense), net: |
|
|
|
|
|
|
|
|
|
|
|
|
|
|
|
|
|
|
|
|
| Interest expense |
|
|
(8,019 |
) |
|
|
(11,353 |
) |
|
|
— |
|
|
|
(11,570 |
)(i) |
|
|
(30,942 |
) |
| Loss on extinguishment of debt |
|
|
(1,086 |
) |
|
|
— |
|
|
|
— |
|
|
|
— |
|
|
|
(1,086 |
) |
| Other, net |
|
|
281 |
|
|
|
(32 |
) |
|
|
— |
|
|
|
— |
|
|
|
249 |
|
|
|
|
|
|
|
|
|
|
|
|
|
|
|
|
|
|
|
|
|
|
| Other expense, net |
|
|
(8,824 |
) |
|
|
(11,385 |
) |
|
|
— |
|
|
|
(11,570 |
) |
|
|
(31,779 |
) |
|
|
|
|
|
|
|
|
|
|
|
|
|
|
|
|
|
|
|
|
|
| Income from continuing operations before income taxes |
|
|
128,040 |
|
|
|
1,860 |
|
|
|
(1,138 |
) |
|
|
(11,570 |
) |
|
|
117,191 |
|
| Income tax benefit (expense) from continuing operations |
|
|
30,093 |
|
|
|
9,827 |
|
|
|
455 |
(i) |
|
|
4,628 |
(j) |
|
|
45,004 |
|
|
|
|
|
|
|
|
|
|
|
|
|
|
|
|
|
|
|
|
|
|
| Income from continuing operations |
|
|
158,133 |
|
|
|
11,687 |
|
|
|
(683 |
) |
|
|
(6,942 |
) |
|
|
162,195 |
|
|
|
|
|
|
|
|
|
|
|
|
|
|
|
|
|
|
|
|
|
|
| Net income |
|
$ |
158,133 |
|
|
$ |
11,687 |
|
|
$ |
(683 |
) |
|
$ |
(6,942 |
) |
|
$ |
162,195 |
|
|
|
|
|
|
|
|
|
|
|
|
|
|
|
|
|
|
|
|
|
|
| Income per common share: |
|
|
|
|
|
|
|
|
|
|
|
|
|
|
|
|
|
|
|
|
| Basic: |
|
|
|
|
|
|
|
|
|
|
|
|
|
|
|
|
|
|
|
|
| Weighted average number of common shares outstanding |
|
|
35,897,641 |
|
|
|
|
|
|
|
|
|
|
|
|
|
|
|
35,897,641 |
|
| Income from continuing operations |
|
|
4.41 |
|
|
|
|
|
|
|
|
|
|
|
|
|
|
|
4.52 |
|
| Loss from discontinued
operations, net |
|
|
— |
|
|
|
|
|
|
|
|
|
|
|
|
|
|
|
— |
|
| Net income |
|
|
4.41 |
|
|
|
|
|
|
|
|
|
|
|
|
|
|
|
4.52 |
|
|
|
|
|
|
|
|
|
|
|
|
|
|
|
|
|
|
|
|
|
|
| Diluted: |
|
|
|
|
|
|
|
|
|
|
|
|
|
|
|
|
|
|
|
|
| Weighted average number of common shares outstanding |
|
|
36,572,146 |
|
|
|
|
|
|
|
|
|
|
|
|
|
|
|
36,572,146 |
|
| Income from continuing operations |
|
|
4.32 |
|
|
|
|
|
|
|
|
|
|
|
|
|
|
|
4.43 |
|
| Loss from discontinued
operations, net |
|
|
— |
|
|
|
|
|
|
|
|
|
|
|
|
|
|
|
— |
|
| Net income |
|
|
4.32 |
|
|
|
|
|
|
|
|
|
|
|
|
|
|
|
4.43 |
|
|
|
|
|
|
|
|
|
|
|
|
|
|
|
|
|
|
|
|
|
|
20
TopBuild Corp., Inc.
Notes to Unaudited Condensed Consolidated Financial Statements
(dollars in thousands)
| (a) |
A summary of the sources of funds for the USI Acquisition, prepared as if the USI Acquisition had occurred on December 31, 2017, is as follows: |
|
|
|
|
|
| Cash |
|
$ |
17,970 |
|
| Term Loan A |
|
|
100,000 |
|
| New Senior Notes issued hereby |
|
|
375,000 |
|
|
|
|
|
|
| Total sources of funds |
|
$ |
492,970 |
|
|
|
|
|
|
The above funds are being utilized as follows:
|
|
|
|
|
| Cash paid to current stakeholders of USI. |
|
|
475,000 |
|
| Debt issuance costs |
|
|
7,090 |
|
| Transaction fees and expenses |
|
|
10,880 |
|
|
|
|
|
|
| Remaining cash proceeds |
|
$ |
— |
|
|
|
|
|
|
21
The preliminary pro forma allocation of the purchase price, prepared as if the USI Acquisition
had occurred on December 31, 2017, is based on management’s preliminary estimates of the fair value of the assets acquired and the liabilities assumed. These estimates, based on management’s judgment and analysis, resulted in the
following preliminary pro forma allocation of purchase price:
|
|
|
|
|
| Accounts receivable |
|
$ |
57,593 |
|
| Inventory |
|
|
15,605 |
|
| Prepaid expenses and other |
|
|
3,291 |
|
| Property and equipment |
|
|
32,448 |
|
| Identifiable intangible assets |
|
|
217,600 |
|
| Other assets |
|
|
1,366 |
|
| Deferred tax assets |
|
|
4,540 |
|
|
|
|
|
|
| Total assets |
|
$ |
332,443 |
|
|
|
|
|
|
| Accounts payable |
|
$ |
12,563 |
|
| Accrued liabilities |
|
|
27,350 |
|
| Deferred tax liability |
|
|
58,544 |
|
|
|
|
|
|
| Total liabilities |
|
$ |
98,457 |
|
|
|
|
|
|
| Net identifiable assets acquired |
|
$ |
233,986 |
|
| Goodwill |
|
|
241,014 |
|
|
|
|
|
|
| Net assets acquired |
|
$ |
475,000 |
|
|
|
|
|
|
Net assets acquired do not include $10,880 of Transaction fees and expenses that represent costs that cannot
be capitalized and should be expensed in accordance with ASC 805 guidance. These costs are reflected as part of Retained earnings in the pro forma balance sheet as of December 31, 2017.
A summary of the preliminary estimated fair market values and remaining useful lives of identifiable intangible assets are as follows:
|
|
|
|
|
|
|
| |
|
Estimated
value |
|
|
Estimated
useful lives (in years) |
| Trade name portfolio |
|
$ |
11,300 |
|
|
8.5 |
| Customer relationships—residential |
|
|
167,800 |
|
|
12.5 |
| Customer relationships—commercial |
|
|
38,500 |
|
|
9.5 |
|
|
|
|
|
|
|
| Total Identifiable intangible assets |
|
$ |
217,600 |
|
|
|
|
|
|
|
|
|
|
The pro forma adjustment reflects management’s preliminary fair value estimates. As a result of
finalizing the fair market values and related purchase price allocation, the value attributable to identifiable intangible assets may change and result in a corresponding increase or decrease to amortization expense.
Goodwill reflects the preliminary estimate of the excess of the purchase price over the fair value of the identifiable assets to be acquired
and liabilities to be assumed in the Transactions and is not amortized.
22
| (b) |
The following tables summarize the adjustments to Cash and cash equivalents, prepared as if the Transactions had occurred on December 31, 2017: |
|
|
|
|
|
| |
|
December 31,
2017 |
|
| Acquisition adjustments: |
|
|
|
|
| Cash paid to current stakeholders of USI. |
|
$ |
(475,000 |
) |
| Elimination of USI historical Cash and cash equivalents |
|
|
(18,167 |
) |
|
|
|
|
|
| Acquisition adjustment |
|
$ |
(493,167 |
) |
|
|
|
|
|
| |
|
December 31,
2017 |
|
| Financing adjustments: |
|
|
|
|
| Funds from borrowing under Term Loan A. |
|
$ |
100,000 |
|
| Funds from borrowing under New Senior Notes issued hereby |
|
|
375,000 |
|
| Payment of debt issuance costs |
|
|
(7,090 |
) |
| Payment of transaction fees and expenses |
|
|
(10,880 |
) |
|
|
|
|
|
| Financing adjustment |
|
$ |
457,030 |
|
|
|
|
|
|
| (c) |
The following table summarizes the adjustments to Current portion of long-term debt and Long-term debt balances, prepared as if the USI Acquisition had occurred on December 31, 2017: |
|
|
|
|
|
|
|
|
|
| |
|
Current portion
of long-term debt |
|
|
Long-term
debt |
|
| Borrowing under Term Loan A |
|
$ |
5,000 |
|
|
$ |
95,000 |
|
| Borrowing under New Senior Notes issued hereby |
|
|
|
|
|
|
375,000 |
|
| Debt issuance costs |
|
|
|
|
|
|
(7,090 |
) |
|
|
|
|
|
|
|
|
|
| Sub-total |
|
$ |
5,000 |
|
|
$ |
462,910 |
|
| Elimination of historical current & long-term debt |
|
|
(1,200 |
) |
|
|
(118,294 |
) |
| (d) |
The change in deferred tax liabilities results from adjustments to property and equipment and identifiable intangible assets and is based on management’s preliminary estimates of fair value. The table below
summarizes the adjustment: |
|
|
|
|
|
| Fair value of deferred tax liabilities on date of Acquisition |
|
$ |
58,544 |
|
| Less: Historical deferred tax liabilities for USI |
|
|
(20,375 |
) |
|
|
|
|
|
| Adjustment |
|
$ |
38,169 |
|
|
|
|
|
|
| (e) |
Represents the impact of eliminating historical balances of USI, as of December 31, 2017. |
23
| (f) |
Represents the change in amortization expense resulting from preliminary purchase accounting adjustments assuming the Transactions occurred on January 1, 2017. The following table summarizes the adjustments to Cost
of sales and Selling, general, and administrative expense as a result of change in amortization expense: |
|
|
|
|
|
| |
|
Year ended
December 31,
2017 |
|
| Cost of Sales: |
|
|
|
|
| Historical amortization |
|
$ |
(5,562 |
) |
| Adjusted amortization |
|
|
— |
|
|
|
|
|
|
| Adjustment |
|
$ |
(5,562 |
) |
| Selling, general, and administrative expense: |
|
|
|
|
| Historical amortization |
|
$ |
(9,044 |
) |
| Adjusted amortization |
|
|
18,806 |
|
|
|
|
|
|
| Adjustment |
|
$ |
9,762 |
|
| (g) |
Represents the change in depreciation expense resulting from preliminary purchase accounting adjustments assuming the Transaction occurred on January 1, 2017. The following table summarizes the adjustment to
Selling, general, and administrative expense as a result of change in depreciation expense: |
|
|
|
|
|
| |
|
Year ended
December 31,
2017 |
|
| Selling, general, and administrative expense: |
|
|
|
|
| Historical depreciation |
|
$ |
(8,381 |
) |
| Adjusted depreciation |
|
|
5,319 |
|
|
|
|
|
|
| Adjustment |
|
$ |
(3,062 |
) |
The net impact on Selling, general and administrative expense as a result of above adjustment and adjustment
described in (f) above is $6,700.
| (h) |
Represents fees and expenses of $10,880 that cannot be capitalized and should be expensed in accordance with ASC 805 guidance. These costs are reflected as part of retained earnings in the pro forma balance sheet as of
December 31, 2017. |
| (i) |
Represents estimated interest expense assuming the Transactions occurred on January 1, 2017. The interest expense adjustment for the Transactions was calculated as follows: |
|
|
|
|
|
| |
|
Year ended
December 31,
2017 |
|
| Interest on New Term Loan A and Senior Notes issued hereby at assumed interest rate |
|
$ |
(23,809 |
) |
| Amortization of deferred financing costs |
|
|
886 |
|
| Less: Historical interest expense |
|
|
11,353 |
|
|
|
|
|
|
| Total interest expense adjustment |
|
$ |
(11,570 |
) |
|
|
|
|
|
| (j) |
Reflects a 40% effective tax rate (35% federal tax and 5% state tax) for the year ended December 31, 2017. Transaction costs have been deemed non-deductible and no benefits
from permanent differences have been considered in determining the tax expense. |
24
|
|
|
|

|
|
Deloitte & Touche LLP 50 South
6th Street Suite 2800
Minneapolis, MN 55402-1538
USA
Tel: +1 612 397 4000 Fax: +1 612 397 4450
www.deloitte.com |
INDEPENDENT AUDITORS’ REPORT
To the Board of Directors and Stockholder of
USI Legend Parent,
Inc.
St. Paul, Minnesota
We have audited
the accompanying combined financial statements of the Installation Services Business of USI Legend Parent, Inc. (the “Company”), which comprise the combined balance sheet as of December 31, 2017, and the related combined statements of
income, changes in equity, and cash flows for the year then ended, and the related notes to the combined financial statements.
Management’s
Responsibility for the Combined Financial Statements
Management is responsible for the preparation and fair presentation of the
combined financial statements in accordance with accounting principles generally accepted in the United States of America; this includes the design, implementation, and maintenance of internal control relevant to the preparation and fair
presentation of the combined financial statements that are free from material misstatement, whether due to fraud or error.
Auditors’
Responsibility
Our responsibility is to express an opinion on the combined financial statements based on our audit. We conducted our
audit in accordance with auditing standards generally accepted in the United States of America. Those standards require that we plan and perform the audit to obtain reasonable assurance about whether the combined financial statements are free from
material misstatement.
An audit involves performing procedures to obtain audit evidence about the amounts and disclosures in the combined
financial statements. The procedures selected depend on the auditor’s judgment, including the assessment of the risks of material misstatement of the combined financial statements, whether due to fraud or error. In making those risk
assessments, the auditor considers internal control relevant to the Company’s preparation and fair presentation of the combined financial statements in order to design audit procedures that are appropriate in the circumstances, but not for the
purpose of expressing an opinion on the effectiveness of the Company’s internal control. Accordingly, we express no such opinion. An audit also includes evaluating the appropriateness of accounting policies used and the reasonableness of
significant accounting estimates made by management, as well as evaluating the overall presentation of the combined financial statements.
We believe that the audit evidence we have obtained is sufficient and appropriate to provide a basis for our audit opinion.
25
Opinion
In our opinion, the combined financial statements referred to above present fairly, in all material respects, the financial position of the
Installation Services Business of USI Legend Parent, Inc., as of December 31, 2017, and the results of its operations and its cash flows for the year then ended in accordance with accounting principles generally accepted in the United States of
America.
Emphasis of Matter
As
discussed in Note 1 to the combined financial statements, the combined financial statements of the Company have been prepared from USI Legend Parent’s accounting records and include allocations of certain costs from USI Legend Parent, Inc.
These allocations may not be reflective of the actual expenses that would have been incurred had the Company operated as a stand-alone entity apart from USI Legend Parent, Inc. Our opinion is not modified with respect to this matter.

March 29, 2018
26
INSTALLATION SERVICES BUSINESS OF USI LEGEND PARENT, INC.
COMBINED BALANCE SHEET
AS OF DECEMBER 31, 2017
(In thousands)
|
|
|
|
|
| ASSETS |
|
|
|
|
| CURRENT ASSETS: |
|
|
|
|
| Cash and cash equivalents |
|
$ |
18,167 |
|
| Accounts receivable—net |
|
|
44,691 |
|
| Inventory |
|
|
15,605 |
|
| Prepaid expenses and other |
|
|
3,291 |
|
| Costs and estimated earnings in excess of billings on uncompleted contracts |
|
|
12,902 |
|
|
|
|
|
|
| Total current assets |
|
|
94,656 |
|
| PROPERTY AND EQUIPMENT—Net |
|
|
25,243 |
|
| GOODWILL |
|
|
160,623 |
|
| OTHER INTANGIBLE ASSETS—Net |
|
|
100,253 |
|
| OTHER ASSETS |
|
|
1,366 |
|
|
|
|
|
|
| TOTAL ASSETS |
|
$ |
382,141 |
|
|
|
|
|
|
|
|
|
|
|
| LIABILITIES AND EQUITY |
|
|
|
|
| CURRENT LIABILITIES: |
|
|
|
|
| Current maturities of long-term debt |
|
|
1,200 |
|
| Accounts payable |
|
|
12,563 |
|
| Accrued insurance reserve |
|
|
9,801 |
|
| Accrued compensation |
|
|
7,158 |
|
| Other current liabilities |
|
|
6,942 |
|
| Billings in excess of costs and estimated earnings on uncompleted contracts |
|
|
1,832 |
|
| Accrued expenses |
|
|
1,617 |
|
|
|
|
|
|
| Total current liabilities |
|
|
41,113 |
|
| LONG-TERM DEBT—Net of current maturities |
|
|
118,294 |
|
| LONG-TERM DEFERRED TAX LIABILITY |
|
|
20,375 |
|
|
|
|
|
|
| Total liabilities |
|
|
179,782 |
|
|
|
|
|
|
| COMMITMENTS AND CONTINGENCIES (Note 11) |
|
|
|
|
| EQUITY: |
|
|
|
|
| Net Parent investment |
|
|
202,359 |
|
|
|
|
|
|
| TOTAL LIABILITIES AND EQUITY |
|
$ |
382,141 |
|
|
|
|
|
|
See accompanying notes to combined financial statements.
27
INSTALLATION SERVICES BUSINESS OF USI LEGEND PARENT, INC.
COMBINED STATEMENT OF INCOME
FOR THE YEAR ENDED DECEMBER 31, 2017
(In thousands)
|
|
|
|
|
| NET SALES |
|
$ |
361,676 |
|
| COST OF SALES (includes $4.8 million of amortization of contract backlog
intangibles) |
|
|
271,102 |
|
|
|
|
|
|
| GROSS PROFIT |
|
|
90,574 |
|
|
|
|
|
|
| OPERATING EXPENSES: |
|
|
|
|
| Selling expenses |
|
|
20,611 |
|
| General and administration expenses |
|
|
45,258 |
|
| Amortization of intangible assets (excludes $4.8 million of amortization of contract backlog
intangible) |
|
|
9,044 |
|
| Acquisition related expenses |
|
|
2,416 |
|
|
|
|
|
|
| INCOME FROM OPERATIONS |
|
|
13,245 |
|
|
|
|
|
|
| OTHER (EXPENSE) INCOME: |
|
|
|
|
| Interest income |
|
|
25 |
|
| Interest expense |
|
|
(11,378 |
) |
| Other expense |
|
|
(32 |
) |
|
|
|
|
|
|
|
|
(11,385 |
) |
| INCOME BEFORE INCOME TAX |
|
|
1,860 |
|
| INCOME TAX BENEFIT |
|
|
9,827 |
|
|
|
|
|
|
| NET INCOME |
|
$ |
11,687 |
|
|
|
|
|
|
See accompanying notes to combined financial statements.
28
INSTALLATION SERVICES BUSINESS OF USI LEGEND PARENT, INC.
COMBINED STATEMENT OF CHANGES IN EQUITY
FOR THE YEAR ENDED DECEMBER 31, 2017
(In thousands)
|
|
|
|
|
| |
|
Net Parent
Investment |
|
| BALANCE—January 1, 2017 |
|
$ |
190,048 |
|
| Net income |
|
|
11,687 |
|
| Net transfers from Parent |
|
|
624 |
|
|
|
|
|
|
| BALANCE—December 31, 2017 |
|
$ |
202,359 |
|
|
|
|
|
|
See accompanying notes to combined financial statements.
29
INSTALLATION SERVICES BUSINESS OF USI LEGEND PARENT, INC.
COMBINED STATEMENT OF CASH FLOWS
FOR THE YEAR ENDED DECEMBER 31, 2017
(In thousands)
|
|
|
|
|
| Net income |
|
$ |
11,687 |
|
| Adjustments to reconcile net income to net cash provided by operating activities: |
|
|
|
|
| Depreciation |
|
|
8,381 |
|
| Amortization |
|
|
14,606 |
|
| Loss (gain) on sale of branches |
|
|
(72 |
) |
| Loss (gain) on sale of property and equipment |
|
|
389 |
|
| Provision for doubtful accounts (net of recoveries) |
|
|
251 |
|
| Deferred income taxes |
|
|
(16,959 |
) |
| Changes in operating assets and liabilities—net of effect of acquisitions: |
|
|
|
|
| Accounts receivable |
|
|
(3,977 |
) |
| Inventory |
|
|
(2,326 |
) |
| Prepaid expenses and other |
|
|
1,075 |
|
| Costs in excess of billings—net |
|
|
(1,698 |
) |
| Other assets |
|
|
2,111 |
|
| Accounts payable |
|
|
(1,436 |
) |
| Accrued expenses |
|
|
(3,602 |
) |
| Income taxes payable |
|
|
1,972 |
|
| Other current liabilities |
|
|
3,192 |
|
|
|
|
|
|
| Net cash provided by operating activities |
|
|
13,594 |
|
|
|
|
|
|
| CASH FLOWS FROM INVESTING ACTIVITIES: |
|
|
|
|
| Acquisition of the Installation Services Business of USI Legend Parent, Inc., net of cash
acquired |
|
|
(230,431 |
) |
| Other acquisitions, net of cash acquired |
|
|
(2,928 |
) |
| Purchase of property and equipment |
|
|
(7,481 |
) |
| Proceeds from sale of branches |
|
|
5,453 |
|
| Proceeds from sale of the sale of property and equipment |
|
|
226 |
|
|
|
|
|
|
| Net cash used in investing activities |
|
|
(235,161 |
) |
|
|
|
|
|
| CASH FLOWS FROM FINANCING ACTIVITIES: |
|
|
|
|
| Proceeds of equity issuance |
|
|
160,617 |
|
| Proceeds from issuance of long-term debt |
|
|
123,020 |
|
| Repayments of long term debt |
|
|
(40,040 |
) |
| Deferred financing costs |
|
|
(3,863 |
) |
|
|
|
|
|
| Net cash provided by financing activities |
|
|
239,734 |
|
|
|
|
|
|
| NET INCREASE IN CASH AND CASH EQUIVALENTS |
|
|
18,167 |
|
|
|
| CASH AND CASH EQUIVALENTS: |
|
|
|
|
| Beginning of year |
|
|
— |
|
|
|
|
|
|
| End of year |
|
$ |
18,167 |
|
|
|
|
|
|
| SUPPLEMENTAL DISCLOSURE OF CASH FLOW INFORMATION: |
|
|
|
|
| Cash paid for interest |
|
$ |
10,539 |
|
|
|
|
|
|
| Cash paid for income taxes |
|
$ |
4,155 |
|
|
|
|
|
|
| See accompanying notes to consolidated financial statements. |
|
|
|
|
30
INSTALLATION SERVICES BUSINESS OF USI LEGEND PARENT, INC.
NOTES TO COMBINED FINANCIAL STATEMENTS
AS OF AND FOR THE YEAR ENDED DECEMBER 31, 2017
(In thousands)
1. Nature of Business,
Proposed Transaction and Basis Of Presentation
Nature of Business—The Installation Services Business of USI Legend
Parent, Inc. (the “Company”) provides a variety of installation services primarily to residential construction markets. The Company’s principal services are installation of insulation and other specialty products. Based in St. Paul,
Minnesota, the Company has 39 locations located across 13 states.
Proposed Transaction—Sale of Installation Services Business
of USI Legend Parent, Inc.—On March 1, 2018, Legend Holdings, LLC (“Holdco”), entered into a definitive agreement to sell the Installation Services Business of USI Legend Parent, Inc. to TopBuild Corp. in an all cash transaction
valued at $475 million (the “Proposed Transaction”). To facilitate the Proposed Transaction, Holdco will sell all the shares of its wholly-owned subsidiary, USI Legend Parent, Inc. (Parent). Parent operates two lines of business,
Installation Services (“IS”) and Construction Services (“CS”). In connection with the closing of the Proposed Transaction, Parent will sell or distribute USI Construction Services, LLC, the entity within which the Construction
Services Business operates, to a newly-formed subsidiary of Holdco, and accordingly, Holdco will not sell any of the CS business in connection with the Proposed Transaction.
The Proposed Transaction is expected to be completed in mid-2018; however, there can be no assurance
regarding the ultimate timing of the Proposed Transaction or that the Proposed Transaction will be completed. Completion of the Proposed Transaction is subject to certain customary conditions, including, among other things, completion of the
Hart-Scott-Rodino process.
Basis of Presentation—
The Installation Services Business
The Company has historically operated as part of Parent and not as a standalone Company. The combined financial statements of the Company have
been derived from Parent’s consolidated financial statements and historical accounting records, and are presented on a carve-out basis. All revenues and costs, as well as assets and liabilities directly
associated with the business activity of the Company, are included in the financial statements. The financial statements also include allocations of certain assets and liabilities, and general and administration expenses. The allocation of general
and administration expenses relates to corporate expenses for certain support functions that are provided on a centralized basis, such as expenses related to executive management, finance, audit, legal, information technology, human resources, and
facilities. These corporate functions largely support the historical Installation Services Business. With the exception of $116, all of the historical corporate support costs have been allocated to the Company’s Combined Statement of Income
within general and administration expenses. See further discussion of allocations in Note 2.
The combined financial statements include
the accounts of the Installation Services Business of USI Legend Parent, Inc., including certain assets and liabilities that have historically been held at Parent’s corporate level but are specifically identifiable or otherwise attributable to
Installation Services, or are expected to be transferred to, or assumed by, the buyer upon consummation of the Proposed Transaction. Net Parent investment represents Parent’s interest in the recorded net assets of the Company. All transactions
between the Company and Parent have been included in the accompanying combined financial statements. Transactions with Parent are reflected in the accompanying Combined Statements of Changes in Equity as “Net transfers to Parent” and in
the accompanying Combined Balance Sheets within “Net Parent investment”. Intercompany accounts and transactions have been eliminated.
31
The amounts recognized by the Company are not necessarily representative of the amounts that
would have been reflected in the financial statements had the Company operated independently of Parent. The combined financial statements have been prepared in accordance with accounting principles generally accepted in the U.S. (“GAAP”).
Acquisition of USI by Parent on January 5, 2017
Pursuant to the Agreement and Plan of Merger (the “Transaction”), on January 5, 2017, the Parent acquired 100% of the equity
interests of USI Senior Holdings, Inc. (“USI”). Parent was formed to make the acquisition and is owned by Holdco, which is owned by Trilantic Capital Partners V (North America) L.P. (“Trilantic”), a private equity fund, and by
certain employees and former shareholders of USI who exchanged certain of their shares in USI for shares in Holdco.
Transaction
consideration, and fees and expenses, were funded through a combination of equity financing from Trilantic and management, rollover of equity from certain existing USI shareholders, and borrowings under a term loan.
The Company has evaluated the Transaction and has determined Parent to be the acquirer for accounting purposes, and USI is the acquiree. The
Transaction was accounted for as a business combination using the acquisition method of accounting, and the financial statements reflect a new basis of accounting that is based on the fair value of the net assets acquired. See Note 7 for further
discussion of the Transaction. For accounting purposes, January 1, 2017 has been designated as the acquisition date as the difference between January 1, 2017 and January 5, 2017 is not material. Accordingly, the 2017 combined
financial statements include the activities of the Installation Services Business for the full year.
2. Significant Accounting Policies
Use of Estimates—The preparation of combined financial statements requires management to make estimates and assumptions that
affect the reported amounts of assets and liabilities, the disclosure of contingent assets and liabilities as of the date of the combined financial statements, and the reported amounts of revenues and expenses during the reporting period. The key
estimates made by management include the determination of fair values in conjunction with the Transaction, allocation of costs, allowance for doubtful accounts receivable, useful lives for property and equipment, useful lives for intangible assets,
insurance reserves, and estimated costs to be incurred on contracts accounted for under the percentage-of-completion method. Actual results could differ from these
estimates.
Cash and Cash Equivalents—Cash is managed centrally. All cash and cash equivalents of Parent at December 31,
2017 were allocated to the Company. The Company considers highly liquid investments with maturities of three months or less to be cash equivalents. The balances in cash accounts, at times, may exceed federally insured limits.
Fair Value Measurements—Accounting Standards Codification (“ASC”) Topic No. 820, Fair Value Measurements and
Disclosures, establishes a framework for measuring fair value for related disclosures. Broadly, the framework requires fair value to be determined based on the exchange price that would be received for an asset or paid to transfer a liability
(an exit price) in the principal or most advantageous market for the asset or liability in an orderly transaction between market participants. It also establishes a three-level valuation hierarchy based upon observable and nonobservable inputs.
For financial assets and liabilities, fair value is the price the Company would receive to sell an asset or pay to transfer a liability in an
orderly transaction with a market participant at the measurement date. In the absence of active markets for the identical assets or liabilities, such measurements involve developing assumptions based on market observable data and, in the absence of
such data, internal information that is
32
consistent with what market participants would use in a hypothetical transaction that occurs at the measurement date. Observable inputs reflect market data obtained from independent sources,
while unobservable inputs reflect the Company’s market assumptions. Preference is given to observable inputs. These two types of inputs create the following fair value hierarchy:
Level 1—Quoted prices for identical instruments in active markets.
Level 2—Quoted prices for similar instruments in active markets; quoted prices for identical or similar instruments in
markets that are not active; and model-derived valuations whose inputs are observable or whose significant value drivers are observable.
Level 3—Significant inputs to the valuation model are unobservable.
Accounts Receivable—Net—The Company does business with a large number of individual customers, primarily residential home and
commercial builders. The Company monitors its exposure for credit losses and maintains related allowances for doubtful accounts (see Note 4). Allowances are estimated based upon specific customer balances, where a risk of default has been
identified, and also include a provision for noncustomer-specific defaults based upon the aging of invoices.
Inventory—Inventory consists primarily of finished goods-insulation materials and supplies used or sold in the ordinary course of
business. Inventory is stated at the lower of cost (on a first-in, first-out basis) or market, defined as net realizable value.
Property and Equipment—Property and equipment, including leasehold improvements to existing facilities, acquired in a business
combination are initially recorded at their estimated fair value. Property and equipment acquired in the normal course of business are initially recorded at cost. Depreciation expense is computed using the straight-line method over the estimated
useful lives of 20 to 39 years for buildings, remaining lease term or useful life (whichever is less) for leasehold improvements; three to seven years for office furniture and technology; seven years for machinery and equipment; and five to seven
years for trucks and autos. Maintenance and repair costs are charged against earnings as incurred.
Goodwill—Goodwill results
from business combinations and represents the excess of the purchase price over the fair value of acquired tangible assets and liabilities and identifiable intangible assets. Annually on December 31, or if conditions indicate an additional
review is necessary, the Company assesses qualitative factors to determine if it is more likely than not that the fair value of the reporting unit is less than its carrying amount and if it is necessary to perform the quantitative goodwill
impairment test. If the Company performs the quantitative test, it compares the carrying value of the reporting unit to an estimate of the reporting unit’s fair value to identify potential impairment. The fair value of the reporting unit is
estimated using a discounted cash flow model. Where available, and as appropriate, comparable market multiples are also used to corroborate the results of the discounted cash flow models. In determining the estimated future cash flow, the Company
considers and applies certain estimates and judgments, including current and projected future levels of income based on management’s plans, business trends, prospects and market and economic conditions and market-participant considerations. If
the estimated fair value of the reporting unit is less than the carrying value, a goodwill impairment loss is recorded for the difference, up to the amount of the total goodwill. At December 31, 2017, the Company tested the goodwill for
impairment and concluded that the fair value of the reporting unit exceeded its carrying value. There was no goodwill impairment loss for the year ended December 31, 2017.
Other Intangible Assets and Impairment of Long-Lived Assets—Other intangible assets consist of customer relationships, business
trade names, leasehold interests and non-compete agreements. Amortization of finite-lived intangible assets is recorded to reflect the pattern of economic benefits based on projected revenues over their
respective estimated useful lives. The Company does not have any indefinite-lived intangible assets other than goodwill.
33
The Company reviews long-lived assets whenever events or changes in circumstances indicate that
the carrying value of an asset may not be recoverable. In the event that the sum of the expected undiscounted cash flows of the long-lived asset group is less than the carrying amount of such assets, an impairment loss would be recognized. When
impairment is identified, the carrying amount of the asset is reduced to its estimated fair value. Assets to be disposed of are recorded at the lower of net book value or fair market value less cost to sell at the date management commits to a plan
of disposal. There was no impairment loss for the year ended December 31, 2017.
Insurance Reserves—The Company is
self-insured for certain losses related to auto, workers’ compensation, and general liability insurance. Although the Company obtains third-party insurance coverage to limit its exposure to these claims, the legal liability remains with the
Company. The liabilities represent the Company’s best estimate of its costs, using generally accepted actuarial reserving methods, of the obligations for reported claims plus those incurred but not reported claims through December 31,
2017. The accruals are adjusted as new information develops or circumstances change that would affect the estimated liability.
Revenue
Recognition—The Company uses fixed price contracts and recognizes revenues from contracts on the percentage-of-completion method, measured by the percentage of
direct cost incurred to date to estimated total direct costs for each contract. The percentage-of-completion method is used because management considers total cost to be
the best available measure of progress on the contracts. Because of inherent uncertainties in estimating direct costs, management estimates are periodically evaluated and adjusted over time. Such adjustments have not historically been material.
Contract costs include all direct material and labor costs as well as other direct costs incurred to complete a specific job. Other indirect costs related to contract performance, such as indirect labor, supplies, tools, fuel, repairs, and
depreciation are not included in contract costs and, along with selling, general, and administrative costs, are charged to expense as incurred.
Revenue from the contracts on the percentage of completion method is not recognized until all of the following have occurred:
(i) persuasive evidence of an arrangement exists; (ii) the price is fixed or determinable; and (iii) the ability to collect is reasonably assured. Revenue is recognized net of adjustments and discounts.
Cost Allocations—The combined financial statements of the Company include the majority of Parent’s general and administration
corporate function support expenses (“support expenses”). Support expenses include items such as executive management, finance, audit, legal, information technology, human resources, and facilities. Parent reviewed the support expenses and
allocated the expenses between the Company and Construction Services on the basis of direct usage. With the exception of $116 that was allocated to CS, all of the support expenses historically incurred by Parent on behalf of its consolidated group
have been allocated to the Company’s Combined Statement of Income and are presented within general and administration expenses.
In connection with the Transaction, IS was assigned goodwill and identifiable intangible assets that were directly attributable to the
Installation Services Business. Accordingly, the combined financial statements reflect goodwill and the identifiable intangibles and related amortization expense that was directly attributable to the Company as a result of the Transaction described
above.
USI is the primary obligor of the outstanding debt as of December 31, 2017 and will remain part of the Company upon
completion of the Proposed Transaction. Parent is a guarantor of the debt, and through the Proposed Transaction the debt will be legally transferred to the buyer or extinguished contemporaneous with the close of the Proposed Transaction.
Accordingly, all of the debt and all of the related interest expense has been included in the combined financial statements of the Company.
The Company considers the allocation methodology regarding the support expenses, to be reasonable for the year ended December 31, 2017.
Nevertheless, the combined financial statements of the Company may not reflect the actual expenses that would have been incurred and may not reflect the Company’s combined statement
34
of income, balance sheet and cash flows had it been a stand-alone company during the year ended December 31, 2017. Actual costs that would have been incurred if the Company had been a
stand-alone company would depend on multiple factors including organization structure, capital structure and strategic decisions made in various areas, including information technology and infrastructure.
Advertising Costs—Advertising costs are expensed as incurred. Advertising expense was $858 for the year ended December 31,
2017 and is included in selling expenses on the combined statements of income.
Income Taxes—The operations of the historical
consolidated group of Parent have been included in a consolidated federal return. Income tax expense and other income tax related information contained in these combined financial statements are presented on a separate return approach as if the
Company filed its own tax returns. Under this approach, the provision for income taxes represents income tax paid or payable (or received or receivable) for the current year plus the change in deferred taxes during the year calculated as if the
Company were a stand-alone taxpayer filing hypothetical income tax returns where applicable.
The Company utilizes an asset and liability
approach for financial accounting and reporting for income taxes. Deferred income taxes are provided for temporary differences on the basis of assets and liabilities as reported for financial statement purposes and income tax purposes. Deferred tax
assets and liabilities, which are classified as long-term in the combined balance sheet, are adjusted for the effects of changes in tax laws and rates are adjusted for tax laws enacted during the period, and are recorded at the tax rate at which the
Company expects them to be realized. The likelihood that the deferred tax assets will be realized is assessed, and to the extent that recovery is not considered to be more likely than not, a valuation allowance is established. Any valuation
allowance is recognized as an expense or benefit within the tax provision in the combined statement of income.
Comprehensive
Income—The only component of comprehensive income for the year ended December 31, 2017 was net income.
Recently Issued
Accounting Pronouncements Not Yet Adopted—In May 2014, the Financial Accounting Standards Board (“FASB”) issued ASU 2014-09, Revenue from Contracts with Customers (Topic 606), as
amended by ASU 2015-14, “Deferral of Effective Date,” which requires an entity to recognize revenue to depict the transfer of promised goods or services to customers in an amount that reflects
the consideration to which the entity expects to be entitled in exchange for those goods or services. ASU 2014-09 sets forth a new revenue recognition model that requires identifying the contract, identifying
the performance obligations, determining the transaction price, allocating the transaction price to performance obligations and recognizing the revenue upon satisfaction of performance obligations. For nonpublic entities, this ASU is effective for
annual reporting periods beginning after December 15, 2018. The Company plans to adopt the ASU using a modified retrospective transition method. Periods prior to the date of adoption are not retroactively revised, but a cumulative effect of
adoption will be recognized for the impact of the ASU on uncompleted contracts at the date of adoption. The Company has not yet determined the impact that this ASU will have on the combined financial statements.
In February 2016, the FASB issued ASU 2016-2, Leases, under which lessees will recognize most
leases on-balance sheet. This will generally increase reported assets and liabilities. For nonpublic entities, this ASU is effective for annual reporting periods beginning after December 15, 2019. The
Company has not yet determined the impact this ASU will have on the Company’s combined financial statements.
3. Fair Value Measurements
Current assets and liabilities approximate fair value because of the short maturity of these instruments. The carrying value of the long-term
debt approximates fair value, as the debt has a variable rate.
35
4. Accounts Receivable, Net
Accounts receivable, net, consist of the following:
|
|
|
|
|
| |
|
As of December 31
2017 |
|
| Construction contracts: |
|
|
|
|
| Amount currently due |
|
$ |
39,544 |
|
| Retentions receivable |
|
|
4,321 |
|
| Other receivables |
|
|
1,075 |
|
|
|
|
|
|
| Total receivables |
|
|
44,940 |
|
| Less allowance for doubtful accounts |
|
|
(249 |
) |
|
|
|
|
|
| Account receivable—net |
|
$ |
44,691 |
|
|
|
|
|
|
5. Costs and Estimated Earnings on Uncompleted Contracts
Costs and estimated earnings on uncompleted contracts consist of the following:
|
|
|
|
|
| |
|
As of December 31
2017 |
|
| Costs incurred on uncompleted contracts |
|
$ |
26,796 |
|
| Estimated earnings thereon |
|
|
11,976 |
|
| Less billings to date |
|
|
(27,702 |
) |
|
|
|
|
|
| Total costs and estimated earnings on uncompleted contracts |
|
$ |
11,070 |
|
|
|
|
|
|
Such amount is included in the accompanying combined balance sheet under the following captions:
|
|
|
|
|
| |
|
As of December 31
2017 |
|
| Costs and estimated earnings in excess of billings on uncompleted contracts |
|
$ |
12,902 |
|
| Billings in excess of costs and estimated earnings on uncompleted contracts |
|
|
(1,832 |
) |
|
|
|
|
|
| Total costs in excess of billings—net |
|
$ |
11,070 |
|
|
|
|
|
|
6. Property and Equipment
Property and equipment consist of the following:
|
|
|
|
|
| |
|
As of December 31
2017 |
|
| Land |
|
$ |
388 |
|
| Buildings |
|
|
677 |
|
| Leasehold improvements |
|
|
1,386 |
|
| Office furniture and technology |
|
|
3,073 |
|
| Machinery and equipment |
|
|
8,569 |
|
| Trucks and autos |
|
|
19,088 |
|
|
|
|
|
|
| Total property and equipment |
|
|
33,181 |
|
| Less accumulated depreciation |
|
|
(7,938 |
) |
|
|
|
|
|
| Property and equipment—net |
|
$ |
25,243 |
|
|
|
|
|
|
36
7. Business Combinations
Acquisition of USI
On
January 5, 2017, the Parent acquired 100% of the equity interests of USI for $279,400, consisting of cash of $249,900 and an exchange of certain of the equity of certain former USI shareholders for equity in Holdco with a value of $29,500. The
acquisition was accounted for in accordance with ASC Topic 805, “Business Combinations,” using the acquisition method of accounting with Parent as the acquirer.
The total purchase price was allocated to the net tangible and intangible assets acquired, based on their fair values at the date of the
acquisition. Of the total purchase price, $266,714 was allocated to the Company. The allocation of the Installation Services Business purchase price to assets acquired and liabilities assumed was finalized and is as follows in the aggregate:
|
|
|
|
|
| Cash |
|
$ |
6,823 |
|
| Accounts receivable |
|
|
41,577 |
|
| Inventory |
|
|
13,743 |
|
| Prepaid assets |
|
|
3,462 |
|
| Cost and estimated earnings in excess of billings on uncompleted contracts |
|
|
11,600 |
|
| Property and equipment |
|
|
27,987 |
|
| Goodwill |
|
|
160,970 |
|
| Other intangibles |
|
|
113,300 |
|
| Tax receivable |
|
|
2,682 |
|
| Other assets |
|
|
10,339 |
|
|
|
|
|
|
| Total assets acquired |
|
$ |
392,483 |
|
|
|
|
|
|
| Current maturities of long-term debt |
|
$ |
19,353 |
|
| Accounts payable |
|
|
13,541 |
|
| Accrued insurance reserve |
|
|
9,138 |
|
| Accrued compensation |
|
|
11,010 |
|
| Other current liabilities |
|
|
3,823 |
|
| Billings in excess of cost and estimated earnings on uncompleted contracts |
|
|
1,855 |
|
| Accrued expenses |
|
|
2,107 |
|
| Long-term debt, net of current maturities |
|
|
19,457 |
|
| Deferred income taxes |
|
|
45,485 |
|
|
|
|
|
|
| Total liabilities assumed |
|
$ |
125,769 |
|
|
|
|
|
|
| Total purchase price—cash & rollover equity |
|
$ |
266,714 |
|
|
|
|
|
|
The allocation of the purchase price to the net assets acquired and liabilities assumed resulted in the
recognition of the following intangible assets:
|
|
|
|
|
|
|
|
|
| |
|
|
|
|
Useful Life |
|
| Customer relationships |
|
$ |
68,000 |
|
|
|
11.0 |
|
| Trade names |
|
|
40,000 |
|
|
|
15.0 |
|
| Backlog on contracts |
|
|
4,800 |
|
|
|
0.3 |
|
| Leasehold interests |
|
|
500 |
|
|
|
3.2 |
|
|
|
|
|
|
|
|
|
|
| Total |
|
$ |
113,300 |
|
|
|
|
|
|
|
|
|
|
|
|
|
|
The goodwill recognized is primarily attributable to the growth potential of the Company and is not deductible
for tax purposes. The fair value of customer relationships was estimated using a discounted present
37
value income approach. Under the income approach, an intangible asset’s fair value is equal to the present value of future economic benefits to be derived from ownership of the asset.
Indications of value are developed by discounting future net cash flows to their present value at market-based rates of return. The fair value of the trade names was estimated using an income approach, specifically known as the relief from royalty
method. The relief from royalty method is based on the hypothetical royalty stream that would be received if the Company were to license the trade name and was based on expected revenues. The useful life of the intangible assets was determined
considering the period of expected cash flows used to measure the fair value of the intangible assets adjusted as appropriate for the entity-specific factors including legal, regulatory, contractual, competitive, economic or other factors that may
limit the useful life of intangible assets.
USI incurred $2,322 of transaction related expenses that are included in acquisition related
expenses in the combined statement of income for the year ended December 31, 2017.
The Company also acquired the assets of one
business during the year ended December 31, 2017 under an asset purchase agreement with a purchase price of $2,928, which was paid in cash. The acquisition has been accounted for in accordance with ASC Topic 805, “Business
Combinations,” using the acquisition method of accounting.
For the business acquired, the total purchase price was allocated to
the net tangible and intangible assets acquired, based on their fair values at the date of the acquisition. The allocation of the purchase price to assets acquired and a liability assumed was finalized and is as follows in the aggregate:
|
|
|
|
|
| Accounts receivable |
|
$ |
834 |
|
| Inventory |
|
|
250 |
|
| Property and equipment |
|
|
133 |
|
| Goodwill |
|
|
1,250 |
|
| Other intangibles |
|
|
946 |
|
|
|
|
|
|
| Total assets acquired |
|
|
3,413 |
|
|
|
|
|
|
| Accounts payable |
|
|
485 |
|
|
|
|
|
|
| Total liabilities assumed |
|
|
485 |
|
|
|
|
|
|
| Total purchase price |
|
$ |
2,928 |
|
|
|
|
|
|
The allocation of the purchase price to the net assets acquired and liabilities assumed resulted in the
recognition of the following intangible assets:
|
|
|
|
|
| Customer relationships |
|
$ |
883 |
|
| Trade names |
|
|
53 |
|
| Non-compete agreements |
|
|
10 |
|
|
|
|
|
|
| Total |
|
$ |
946 |
|
|
|
|
|
|
The goodwill recognized for the acquisition is primarily attributable to the value of the workforce and
expected synergies, and, is expected to be deductible for tax purposes. The goodwill was all allocated to Installation Services Business. The fair value of the identified intangibles and related useful lives were determined with the same approaches
as used for the intangibles in the Transaction described above.
Sales and net loss of the entity acquired in 2017, since the date of its
acquisition, included in the combined statement of income for the year ended December 31, 2017, were $2,526 and $81, respectively.
The
Company incurred $94 of acquisition-related costs that were expensed during the year ended December 31, 2017. These costs are included in acquisition related expenses in the combined statement of income.
38
8. Goodwill and other Intangible Assets
The following table summarizes the changes in goodwill:
|
|
|
|
|
| |
|
Amount |
|
| Balance as of January 1, 2017 |
|
$ |
160,970 |
|
| Acquisition during 2017 |
|
|
1,250 |
|
| Divestitures during 2017 |
|
|
(1,597 |
) |
|
|
|
|
|
| Balance as of December 31, 2017 |
|
$ |
160,623 |
|
|
|
|
|
|
The divestitures relate to the sale of two branches for aggregate proceeds of $5,243 which resulted in a gain
of $72 that is included in the combined statement of income.
Other intangible assets and related amortization are as follows at December
31, 2017:
|
|
|
|
|
|
|
|
|
|
|
|
|
|
|
|
|
| |
|
Gross
Carrying
Amount |
|
|
Useful
Life
(Years) |
|
|
Accumulated
Amortization |
|
|
Net
Carrying
Amount |
|
| Customer relationships |
|
$ |
68,883 |
|
|
|
7-11 |
|
|
$ |
(6,214 |
) |
|
$ |
62,669 |
|
| Trade names |
|
|
39,904 |
|
|
|
3-15 |
|
|
|
(2,670 |
) |
|
|
37,234 |
|
| Backlog on contracts |
|
|
4,800 |
|
|
|
0.3 |
|
|
|
(4,800 |
) |
|
|
— |
|
| Leasehold interests |
|
|
500 |
|
|
|
3 |
|
|
|
(158 |
) |
|
|
342 |
|
| Non-compete agreements |
|
|
10 |
|
|
|
2 |
|
|
|
(2 |
) |
|
|
8 |
|
|
|
|
|
|
|
|
|
|
|
|
|
|
|
|
|
|
|
|
$ |
114,097 |
|
|
|
|
|
|
$ |
(13,844 |
) |
|
$ |
100,253 |
|
|
|
|
|
|
|
|
|
|
|
|
|
|
|
|
|
|
For the year ended December 31, 2017, amortization of intangible assets expensed to operations was $13,844, of
which $4,800 was included in cost of sales related to the backlog on contracts and $9,044 was included in operating expenses. The weighted average remaining amortization period for intangible assets as of December 31, 2017 was approximately 11
years.
Remaining estimated aggregate annual amortization expense is as follows:
|
|
|
|
|
| 2018 |
|
$ |
9,145 |
|
| 2019 |
|
|
9,144 |
|
| 2020 |
|
|
9,004 |
|
| 2021 |
|
|
8,965 |
|
| 2022 |
|
|
8,965 |
|
| Thereafter |
|
|
55,030 |
|
|
|
|
|
|
|
|
$ |
100,253 |
|
|
|
|
|
|
9. Debt
The components of long-term debt are as follows:
|
|
|
|
|
| |
|
As of December 31
2017 |
|
| Term loan |
|
$ |
121,820 |
|
| Less debt issuance costs—net |
|
|
(2,326 |
) |
|
|
|
|
|
|
|
|
119,494 |
|
| Less current maturities |
|
|
(1,200 |
) |
|
|
|
|
|
| Long term debt—net of current maturities |
|
$ |
118,294 |
|
|
|
|
|
|
39
On January 5, 2017, Parent entered into new revolving credit and term loan agreements that
replaced the prior secured term note facility and the secured asset-based revolving credit agreement. Parent has a $120,000 secured term loan (Term Loan) and a $30,000 secured asset-based revolving credit facility (ABL). Incremental term loans of up
to $25,000 are available if certain financial ratios and other conditions are met. Parent borrowed an additional $3,020 under this provision during 2017. The Term Loan and ABL have a maturity date of January 5, 2022.
Under the ABL agreement, the facility is available on a revolving basis, subject to availability under a borrowing base consisting of 85% of
eligible accounts receivable and generally 60% of eligible inventory. The line is available for issuance of letters of credit to a specified limit of $20,000.
Under the ABL agreement, to determine interest due, Parent can elect the base rate (greatest of prime rate, federal funds rate plus 0.5%, or
LIBOR for three-month period plus 1.0%) plus 0.75% to 1.25%, depending on the amount of borrowings outstanding, or LIBOR for a period of one, two, three or six months as selected by Parent plus 1.75% to 2.25%, depending on the amount of borrowings
outstanding. The interest rate as of December 31, 2017 was 5.25%. Parent also pays a commitment fee equal to 0.50% of the average commitment not utilized. Interest payments are due monthly.
The ABL includes a financial covenant requiring that during any covenant testing trigger period (anytime the excess availability is less than
the greater of 12.5% of the maximum revolver amount or $5.0 million) Parent maintains a fixed charge coverage ratio of at least 1.0 to 1.0 on a rolling twelve-month basis. The fixed charge ratio is defined as earnings before interest, taxes,
depreciation and amortization (EBITDA), less capital expenditures, over fixed charges generally defined as cash interest and income taxes, scheduled principal payments on loans, and restricted payments such as dividends. EBITDA, as defined, includes
adjustments for such items as unusual gains, purchase accounting adjustments, interest income, stock-based compensation, non-cash write-offs, debt issuance costs, board of director costs, as well as other
adjustments. As of December 31, 2017, Parent is in compliance with this financial covenant.
The Term Loan agreement is repayable in
equal quarterly installments in an aggregate amount equal to 0.25% of the original amount of the Term Loan, with the balance payable on January 5, 2022. Parent must offer principal prepayments to the lender for certain proceeds of equity, debt
and disposition of assets, and for extraordinary receipts. Parent must also offer principal prepayments annually in an amount of 50% of any excess cash flow, as defined (the 50% is subject to step-downs to 25% and 0% depending on the leverage ratio
as defined in the Term Loan agreement). For 2017, there was no principal prepayment required.
Under the Term Loan agreement, to determine
interest due, Parent can elect the base rate (greatest of prime rate, federal funds rate plus 0.5%, LIBOR for one-month period plus 1.0%, or 2%) plus 6.25%; or a LIBOR rate (of at least 1.0%) for a period of
one, two, three or six months as selected by Parent plus 7.25%. The interest rate as of December 31, 2017 was 8.9%.
The Term Loan
includes a financial covenant requiring that Parent maintain a leverage ratio of not greater than 4.75:1.00 through December 31, 2017, 4.25:1.00 through December 31, 2018, and 3.75:1.00 thereafter. The leverage ratio, as defined, is the
amount of funded indebtedness minus unrestricted cash, compared to adjusted EBITDA for the last twelve months. As of December 31, 2017, Parent is in compliance with this financial covenant.
The ABL and Term Loan agreements generally contain similar covenants, and include restrictions on indebtedness, liens, mergers,
consolidations, investments, acquisitions, disposals of assets, and transactions with affiliates. Dividends, redemptions and other payments on equity (restricted payments) are generally limited to excess cash flow, less amounts prepaid on the loan
and less previous restricted payments. Customary events of default (with customary grace periods, notice and cure periods and thresholds) include payment default, breach of representation in any material respect, breach of certain covenants, default
to material indebtedness,
40
bankruptcy, ERISA violations, material judgments, change in control and termination of invalidity of guaranty or security documents.
The ABL and Term Loan are secured by a security interest in all of the Company’s assets, except minor excluded assets.
As of December 31, 2017, $2,326 of debt issuance costs related to the Term Loan, net of amortization of $572, were recorded as a direct
deduction from long-term debt and $775 of debt issuance costs related to the ABL, net of amortization of $191, were recorded in other assets.
Aggregate maturities of long-term debt in future years, are as follows:
|
|
|
|
|
| 2018 |
|
$ |
1,200 |
|
| 2019 |
|
|
1,200 |
|
| 2020 |
|
|
1,200 |
|
| 2021 |
|
|
1,200 |
|
| 2022 |
|
|
117,020 |
|
|
|
|
|
|
|
|
|
121,820 |
|
| Less debt issuance costs—net |
|
|
(2,326 |
) |
|
|
|
|
|
|
|
$ |
119,494 |
|
|
|
|
|
|
10. Income Taxes
The net income tax expense (benefit) consisted of the following:
|
|
|
|
|
| |
|
For the Year Ended
December 31
2017 |
|
| Current: |
|
|
|
|
| Federal |
|
$ |
6,910 |
|
| State |
|
|
219 |
|
|
|
|
|
|
| Total current |
|
|
7,129 |
|
|
|
|
|
|
| Deferred: |
|
|
|
|
| Federal |
|
|
(16,788 |
) |
| State |
|
|
(168 |
) |
|
|
|
|
|
| Total deferred |
|
|
(16,956 |
) |
|
|
|
|
|
| Total tax expense (benefit) |
|
$ |
(9,827 |
) |
|
|
|
|
|
41
The provision (benefit) for income taxes, as a percentage of income before income tax, differs
from the statutory US federal income tax rate due to the following:
|
|
|
|
|
|
|
|
|
| |
|
For the Year Ended
December 31
2017 |
|
| Income tax at federal statutory rate |
|
|
651 |
|
|
|
35.0 |
% |
| State—net of federal benefit |
|
|
201 |
|
|
|
10.8 |
|
| Domestic manufacturing deduction (Section 199) |
|
|
(333 |
) |
|
|
(17.9 |
) |
| Divestitures |
|
|
560 |
|
|
|
30.1 |
|
| IRS audit settlement |
|
|
354 |
|
|
|
19.0 |
|
| Change in tax rate—deferred taxes |
|
|
(11,620 |
) |
|
|
(624.9 |
) |
| Other permanent items |
|
|
360 |
|
|
|
19.4 |
|
|
|
|
|
|
|
|
|
|
| Total tax expense |
|
$ |
(9,827 |
) |
|
|
(528.4 |
)% |
|
|
|
|
|
|
|
|
|
The significant components of the deferred tax assets (liabilities) are as follows:
|
|
|
|
|
| |
|
As of December 31
2017 |
|
| Deferred tax assets: |
|
|
|
|
| Allowance for doubtful accounts |
|
$ |
152 |
|
| Accrued bonus |
|
|
463 |
|
| Inventory |
|
|
734 |
|
| Accrued expenses |
|
|
465 |
|
| Deferred rent |
|
|
87 |
|
| Insurance reserve |
|
|
2,341 |
|
| State net operating losses |
|
|
183 |
|
| Term loan expenses |
|
|
115 |
|
|
|
|
|
|
| Total deferred tax assets |
|
|
4,540 |
|
|
|
|
|
|
| Deferred tax liabilities: |
|
|
|
|
| Prepaid expenses |
|
|
(572 |
) |
| Deferred profit on customer contracts |
|
|
(810 |
) |
| Property and equipment |
|
|
(3,844 |
) |
| Intangible assets |
|
|
(19,689 |
) |
|
|
|
|
|
| Total deferred tax liabilities |
|
|
(24,915 |
) |
|
|
|
|
|
| Net deferred tax liability |
|
$ |
(20,375 |
) |
|
|
|
|
|
The Company assesses the available positive and negative evidence to estimate if sufficient future taxable
income will be generated to utilize the existing deferred tax assets on a jurisdiction and by tax filing entity basis. As of December 31, 2017, the Company has net operating loss (NOL) carryforwards of $3,542 for state income tax purposes. The
state NOLs are generally available to offset future taxable income through the year 2032.
The Company’s U.S. federal income tax
returns for 2014 through 2016 are open to examination. The Company’s fiscal 2014 US federal income tax return had been under audit by the Internal Revenue Services (“IRS”) and the Company received a final determination from the IRS in
June 2017 on the Revenue Agent Report (“RAR”) adjustments, effectively settling this audit with the IRS during the year ended December 31, 2017. The Company has several state tax jurisdictions open to examination for tax years 2010
through 2016. No liability for uncertain tax positions was considered necessary at December 31, 2017. Determining uncertain tax positions and the related estimated amounts requires judgment and carries estimation risk. If future tax law
42
changes or interpretations should come to light, or additional information should become known, the conclusions regarding unrecognized tax benefits may change.
On December 22, 2017, the U.S. government enacted comprehensive tax legislation commonly referred to as the Tax Cuts and Jobs Act (the
“TCJA”). The TCJA makes broad and complex changes to the U.S. tax code, including, but not limited to, reducing the U.S. statutory corporate income tax rate from 35 percent to 21 percent, effective January 1, 2018. GAAP
requires that deferred income tax assets and liabilities be remeasured at the income tax rate expected to apply when those temporary differences reverse, and that the effects of any change to such income tax rate be recognized in the period when the
change was enacted. In connection with the Company’s initial analysis of the impact of the TCJA, the Company recorded a discrete net tax benefit of $11,705 in the year ended December 31, 2017. This net benefit is primarily due to the
remeasurement of the Company’s existing deferred tax assets and liabilities.
The Securities and Exchange Commission (SEC) staff
issued Staff Accounting Bulletin No. 118 (“SAB 118”), which provides guidance on accounting for the tax effects of the TCJA. The FASB has confirmed acceptance of this for non-SEC reporting
companies. SAB 118 provides a measurement period that should not extend beyond one year from the TCJA enactment date for companies to complete the accounting under ASC 740. To the extent that a company’s accounting for certain income tax
effects of the TCJA is incomplete but it is able to determine a reasonable estimate, it must record a provisional estimate in the financial statements.
The Company recorded the effects of the TCJA in 2017 using its best estimates and the information available through the date the financial
statements were issued. However, the Company’s analysis is ongoing and as such, the income tax effects recorded are provisional. As we collect and prepare necessary data, and interpret the TCJA and any additional guidance issued by the U.S.
Treasury Department, the IRS, and other standard-setting bodies, we may make adjustments to the provisional amounts. Those adjustments may materially impact our provision for income taxes and effective tax rate in the period in which the adjustments
are made. The accounting for the tax effects of the TCJA will be completed in 2018.
11. Commitments and Contingencies
Operating Lease Commitments—The Company leases its headquarters and most branch locations under noncancelable operating lease
arrangements that expire in various years through 2023. Several may be renewed for additional periods ranging from one to five years.
Lease expense for the year ended December 31, 2017, was $5,797.
Future minimum payments under all noncancelable leases with initial terms of one year or more as of December 31, 2017, consisted of the
following:
|
|
|
|
|
| 2018 |
|
$ |
5,452 |
|
| 2019 |
|
|
4,873 |
|
| 2020 |
|
|
2,959 |
|
| 2021 |
|
|
1,959 |
|
| 2022 |
|
|
831 |
|
| Thereafter |
|
|
30 |
|
|
|
|
|
|
| Total |
|
$ |
16,104 |
|
|
|
|
|
|
Letter of Credit—Under the Company’s general liability insurance policy it is
obligated to post collateral against future claims. Those collateral obligations totaled $11,939 at December 31, 2017.
In 2017, the
Company satisfied its collateral obligations with a letter of credit issued under its loan facility.
43
Legal Matters—The Company is involved in certain litigation matters in the
normal course of business which, in the opinion of management, will not result in any material adverse effects on the combined financial position, results of operations, or net cash flows of the Company.
12. Retirement Plan
The Parent has a
defined contribution 401(k) profit-sharing plan (the “Plan”). Company employees who are 21 years of age or older and have three months of service are eligible to participate in the Plan. Under the Plan, the Company contributes to the Plan
by matching a portion of employee contributions. The Company contributed to the Plan $376 for the year ended December 31, 2017.
13. Equity
Net Parent investment—In the combined balance sheet, net Parent investment represents Parent’s historical
investment in the Company, the net effect of cost allocations from transactions with CS, net transfers of cash and the Company’s accumulated earnings.
Profits Units Plan—In 2017, Holdco issued profits unit to certain employees of the Company. Profits units provide for
recipients to receive the appreciated value of the profits units from the date of grant to the date of an approved sale of Parent. The profits units are typically subject to a vesting schedule of up to five years with portions based on passage of
time, achieving annual performance targets, or sale of Parent. Recipients of the profits units have liquidity only upon occurrence of a defined payment event such as an approved sale. The Plan calls for a lump sum payment in the same form of
consideration and on the same terms as being paid to the owners of Holdco upon a change of control. The Company accounts for the profits units as liability awards. The likelihood of a payment event as defined is unknown and not measurable;
therefore, the Company has not recorded any liability or recognized any compensation expense relating to the issuance of profits units. The Company will continue to reassess the likelihood of a payment event and record a liability if facts and
circumstances change.
14. Related Parties
Sales between the Company and CS were insignificant for the year ended December 31, 2017.
Transactions between the Company and CS are considered to be effectively settled at the time the transaction is recorded.
15. Subsequent Events
Management of the
Company has analyzed the potential for subsequent events through March 29, 2018, which is the date the combined financial statements were issued.
On January 4, 2018, the Company acquired a business under an asset purchase agreement for a price of $13,157, which was paid in cash. The
allocation of the purchase price to the underlying tangible and intangible assets has not been completed.
As described in Note 1, on
March 1, 2018, Holdco, entered into a definitive agreement to sell the Installation Services Business of USI Legend Parent, Inc. to TopBuild Corp. To facilitate the Proposed Transaction, Holdco will sell all the shares of its wholly-owned
subsidiary, Parent. The Construction Services Business will not be included in the Proposed Transaction.
* * * * * *
44