Exhibit 99.1

NYSE:BLD
The leading purchaser, installer and distributor of insulation products to the U.S. construction industry
TopBuild Reports Strong First Quarter 2018 Results
First Quarter 2018 Financial Highlights
(unless otherwise indicated, comparisons are to the quarter ended March 31, 2017)
|
✓ Net Sales increased 11.3% to $491.4 million, primarily driven by sales volume growth in both operating segments. Of the 11.3% revenue growth, same branch contributed 6.7%.
|
|
“TopBuild reported another strong quarter in both sales and earnings. We are taking full advantage of the ongoing recovery in residential and commercial construction with our national scale as well as our continued focus on improving operational efficiency throughout the Company.”
“We are confident that 2018 will be another year of profitable growth.”
JERRY VOLAS, CEO, TOPBUILD
|
|
✓ Gross margin, impacted by higher material costs, declined 40 basis points to 22.6%.
|
|
|
✓ Operating profit was $33.9 million, compared to an operating loss of $3.5 million. The first quarter 2017 operating loss was the result of a $30 million legal settlement. On an adjusted basis, operating profit was $38.2 million, compared to $28.6 million, a 33.6% improvement.
|
|
|
✓ Operating margin was 6.9% compared to (0.8%). Adjusted operating margin improved 130 basis points to 7.8%.
|
|
|
✓ Net income was $26.4 million, or $0.74 per diluted share, compared to a net loss of $1.7 million, or $0.05 per diluted share. Adjusted net income was $26.2 million, or $0.73 per diluted share, compared to $16.9 million, or $0.46 per diluted share.
|
|
✓ Adjusted EBITDA was $46.0 million, compared to $33.9 million, a 35.8% increase and adjusted EBITDA margin was 9.4%, a 170-basis point improvement. Incremental EBITDA margin was 24.2%. On a same branch basis, compared with prior year total adjusted EBITDA, adjusted EBITDA grew $10.9 million and incremental EBITDA margin was 36.9%.
|
|
✓ At March 31, 2018, the Company had cash and cash equivalents of $37.3 million, availability under the revolving credit facility of $203.0 million and $100 million under a delayed-draw term loan for total liquidity of $340.3 million.
|
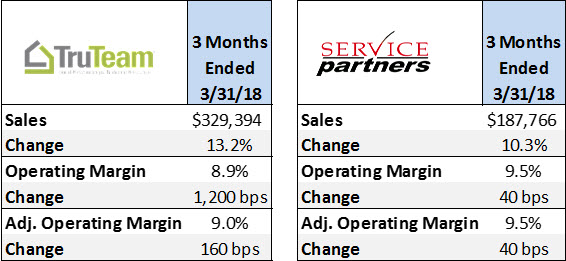
Operating Segment Highlights ($ in 000s)
(comparisons are to the quarter ended March 31, 2017)
Capital Allocation
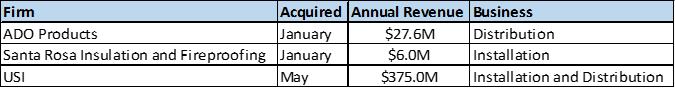
Acquisitions
|
Year-to-date, through May 8, 2018, the Company has completed three acquisitions which are listed below. Combined, they are expected to generate approximately $409 million of incremental revenue on an annual basis.
|
|
“Since closing on our first acquisition in August 2016, we’ve been consistent with regard to our strategy and the types of acquisitions we are seeking. We look for profitable, well-managed companies with solid customer bases that expand our market share and revenue quality in high growth regions and are accretive to earnings. USI, ADO and Santa Rosa check all of these boxes.”
JERRY VOLAS, CEO, TOPBUILD
|
|
|
|
|
Share Repurchases
|
|
|
The Company has completed the $100 million accelerated share repurchase program announced on May 9, 2017. Under the terms of the program, the Company repurchased a total of approximately 1.5 million shares at an average price of $65.74 per share.
The accelerated share repurchase program was completed as part of the Company’s $200 million share repurchase authorization announced on February 28, 2017 and which expires on February 24, 2019. As of May 8, 2018, approximately $65 million of the $200 million authorization was remaining.
|
|
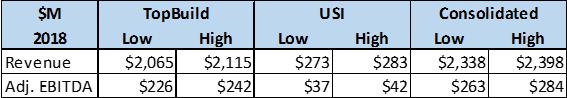
2018 Revenue and Adjusted EBITDA Outlook, Assumptions and Three-Year Targets
Annual Guidance
(Assumes housing starts between 1.250k and 1.280k, includes 8 months of expected revenue from USI with $2M to $4M of cost savings synergies)
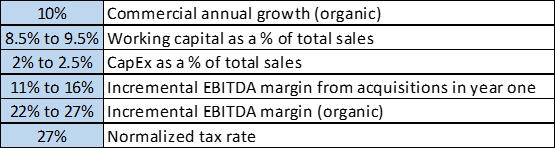
Assumptions
$75 million of incremental revenue for every 50,000 increase in new housing starts
Three-Year Targets
This outlook reflects management’s current view of present and future market conditions and is based on assumptions such as housing starts, general and administrative expenses, weighted average diluted shares outstanding and interest rates. This outlook does not include any effects related to potential acquisitions or divestitures that may occur after the date of this press release. Factors that could cause actual 2018 results to differ materially from TopBuild’s current expectations are discussed below and are also detailed in the Company’s 2017 Annual Report on Form 10‑K and subsequent SEC reports.
2018 ENERGY STAR® Partner of the Year Sustained Excellence Award Received
TopBuild Home Services group received the 2018 ENERGY STAR® Partner of the Year Sustained Excellence Award for continued leadership and superior contributions to ENERGY STAR. TopBuild’s accomplishment was recognized by the U.S. Environmental Protection Agency and the U.S. Department of Energy in Washington, D.C. on April 20, 2018. The Company’s extensively trained Home Energy Raters provide the evaluation, testing and independent verification required to be considered an ENERGY STAR compliant home.
“We are honored to once again be recognized for our leadership role in verifying ENERGY STAR compliant homes,” said Volas. “TopBuild Home Services has been an ENERGY STAR partner for 16 years, working closely with home builders and consumers to create homes that are more comfortable and energy efficient.”
Additional Information
Quarterly supplemental materials, including a presentation that will be referenced on today’s conference call, are available on the “Investors” section of the Company’s website at www.topbuild.com.
Conference Call
A conference call to discuss first quarter 2018 financial results is scheduled for today, Tuesday, May 8, 2018, at 9:30 a.m. Eastern Time. The call may be accessed by dialing (800) 920‑2997. The conference call will be webcast simultaneously on the “Investors” section of the Company’s website at www.topbuild.com.
About TopBuild
TopBuild Corp., headquartered in Daytona Beach, Florida, is the leading purchaser, installer and distributor of insulation products to the U.S. construction industry. We provide insulation services nationwide through TruTeam®, which has over 215 branches, and through Service Partners® which distributes insulation from over 75 branches. We leverage our national footprint to gain economies of scale while capitalizing on our local market presence to forge strong relationships with our customers. To learn more about TopBuild please visit our website at www.topbuild.com.
Use of Non-GAAP Financial Measures
EBITDA, incremental EBITDA margin, adjusted EBITDA margin, the “adjusted” financial measures presented above, and figures presented on a “same branch basis” are not calculated in accordance with U.S. generally accepted accounting principles (“GAAP”). The Company believes that these non-GAAP financial measures, which are used in managing the business, may provide users of this financial information with additional meaningful comparisons between current results and results in prior periods. We define same branch sales as sales from branches in operation for at least 12 full calendar months. Such non-GAAP financial measures are reconciled to their closest GAAP financial measures in tables contained in this press release. Non-GAAP financial measures should be viewed in addition to, and not as an alternative for, the Company’s reported results under GAAP. Additional information may be found in the Company’s filings with the Securities and Exchange Commission which are available on TopBuild’s website under “Investors” at www.topbuild.com.
Safe Harbor Statement
This press release contains “forward-looking statements” within the meaning of the Private Securities Litigation Reform Act. These forward-looking statements may address, among other things, our expected financial and operational results and the related assumptions underlying our expected results. These forward-looking statements are distinguished by use of words such as “will,” “would,” “anticipate,” “expect,” “believe,” “designed,” “plan,” or “intend,” the negative of these terms, and similar references to future periods. These views involve risks and uncertainties that are difficult to predict and, accordingly, our actual results may differ materially from the results discussed in our forward-looking statements. Our forward-looking statements contained herein speak only as of the date of this press release. Factors or events that we cannot predict, including those described in the risk factors contained in our filings with the Securities and Exchange Commission, may cause our actual results to differ from those expressed in forward-looking statements. Although TopBuild believes the expectations reflected in such forward-looking statements are based on reasonable assumptions, the Company can give no assurance that its expectations will be achieved and it undertakes no obligation to update publicly any forward-looking statements as a result of new information, future events, or otherwise, except as required by applicable law.
Investor Relations and Media Contact
Tabitha Zane
tabitha.zane@topbuild.com
386‑763‑8801
(tables follow)
TopBuild Corp.
Condensed Consolidated Statements of Operations (Unaudited)
(in thousands, except share and per common share amounts)
|
|
|
|
|
|
|
|
|
|
|
Three Months Ended March 31,
|
|
|
|
2018
|
|
2017
|
|
Net sales
|
|
$
|
491,444
|
|
$
|
441,363
|
|
Cost of sales
|
|
|
380,426
|
|
|
339,735
|
|
Gross profit
|
|
|
111,018
|
|
|
101,628
|
|
|
|
|
|
|
|
|
|
Selling, general, and administrative expense (exclusive of significant legal settlement, shown separately below)
|
|
|
77,125
|
|
|
75,091
|
|
Significant legal settlement
|
|
|
—
|
|
|
30,000
|
|
Operating profit (loss)
|
|
|
33,893
|
|
|
(3,463)
|
|
|
|
|
|
|
|
|
|
Other income (expense), net:
|
|
|
|
|
|
|
|
Interest expense
|
|
|
(2,324)
|
|
|
(1,370)
|
|
Other, net
|
|
|
34
|
|
|
107
|
|
Other expense, net
|
|
|
(2,290)
|
|
|
(1,263)
|
|
Income (loss) before income taxes
|
|
|
31,603
|
|
|
(4,726)
|
|
|
|
|
|
|
|
|
|
Income tax (expense) benefit
|
|
|
(5,215)
|
|
|
3,016
|
|
Net income (loss)
|
|
$
|
26,388
|
|
$
|
(1,710)
|
|
|
|
|
|
|
|
|
|
Net income (loss) per common share:
|
|
|
|
|
|
|
|
Basic
|
|
$
|
0.75
|
|
$
|
(0.05)
|
|
Diluted
|
|
$
|
0.74
|
|
$
|
(0.05)
|
|
|
|
|
|
|
|
|
|
Weighted average shares outstanding:
|
|
|
|
|
|
|
|
Basic
|
|
|
35,059,920
|
|
|
37,123,245
|
|
Diluted
|
|
|
35,819,242
|
|
|
37,123,245
|
TopBuild Corp.
Condensed Consolidated Balance Sheets and Other Financial Data (Unaudited)
(dollars in thousands)
|
|
|
|
|
|
|
|
|
|
|
As of
|
|
|
|
March 31,
|
|
December 31,
|
|
|
|
2018
|
|
2017
|
|
ASSETS
|
|
|
|
|
|
|
|
Current assets:
|
|
|
|
|
|
|
|
Cash and cash equivalents
|
|
$
|
37,334
|
|
$
|
56,521
|
|
Receivables, net of an allowance for doubtful accounts of $3,008 and $3,673 at March 31, 2018, and December 31, 2017, respectively
|
|
|
313,568
|
|
|
308,508
|
|
Inventories, net
|
|
|
138,447
|
|
|
131,342
|
|
Prepaid expenses and other current assets
|
|
|
11,532
|
|
|
15,221
|
|
Total current assets
|
|
|
500,881
|
|
|
511,592
|
|
|
|
|
|
|
|
|
|
Property and equipment, net
|
|
|
115,441
|
|
|
107,121
|
|
Goodwill
|
|
|
1,082,815
|
|
|
1,077,186
|
|
Other intangible assets, net
|
|
|
48,437
|
|
|
33,243
|
|
Deferred tax assets, net
|
|
|
18,129
|
|
|
18,129
|
|
Other assets
|
|
|
2,235
|
|
|
2,278
|
|
Total assets
|
|
$
|
1,767,938
|
|
$
|
1,749,549
|
|
|
|
|
|
|
|
|
|
LIABILITIES
|
|
|
|
|
|
|
|
Current liabilities:
|
|
|
|
|
|
|
|
Accounts payable
|
|
$
|
254,384
|
|
$
|
263,814
|
|
Current portion of long-term debt - term loan
|
|
|
12,500
|
|
|
12,500
|
|
Current portion of long-term debt - equipment notes
|
|
|
1,858
|
|
|
—
|
|
Accrued liabilities
|
|
|
74,534
|
|
|
75,087
|
|
Total current liabilities
|
|
|
343,276
|
|
|
351,401
|
|
|
|
|
|
|
|
|
|
Long-term debt - term loan
|
|
|
225,329
|
|
|
229,387
|
|
Long-term debt - equipment notes
|
|
|
8,208
|
|
|
—
|
|
Deferred tax liabilities, net
|
|
|
132,840
|
|
|
132,840
|
|
Long-term portion of insurance reserves
|
|
|
33,818
|
|
|
36,160
|
|
Other liabilities
|
|
|
3,672
|
|
|
3,242
|
|
Total liabilities
|
|
|
747,143
|
|
|
753,030
|
|
|
|
|
|
|
|
|
|
EQUITY
|
|
|
1,020,795
|
|
|
996,519
|
|
Total liabilities and equity
|
|
$
|
1,767,938
|
|
$
|
1,749,549
|
|
|
|
|
|
|
|
|
|
|
|
|
As of March 31,
|
|
|
|
2018
|
|
2017
|
|
|
Other Financial Data
|
|
|
|
|
|
|
|
|
Working Capital Days†
|
|
|
|
|
|
|
|
|
Receivable days
|
|
|
49
|
|
|
45
|
|
|
Inventory days
|
|
|
34
|
|
|
30
|
|
|
Accounts payable days
|
|
|
80
|
|
|
84
|
|
|
Working capital
|
|
$
|
197,631
|
|
$
|
155,018
|
|
|
Working capital as a percent of sales (LTM)‡
|
|
|
10.0
|
%
|
|
8.8
|
%
|
|
|
|
† Adjusted for remaining acquisition day one balance sheet items
‡ Last 12 months sales have been adjusted for the pro forma effect of acquired branches
|
TopBuild Corp.
Condensed Consolidated Statements of Cash Flows (Unaudited)
(dollars in thousands)
|
|
|
|
|
|
|
|
|
|
|
Three Months Ended March 31,
|
|
|
|
2018
|
|
2017
|
|
Net Cash Provided by (Used in) Operating Activities:
|
|
|
|
|
|
|
|
Net income (loss)
|
|
$
|
26,388
|
|
$
|
(1,710)
|
|
Adjustments to reconcile net income (loss) to net cash provided by operating activities:
|
|
|
|
|
|
|
|
Depreciation and amortization
|
|
|
5,442
|
|
|
3,231
|
|
Share-based compensation
|
|
|
2,402
|
|
|
2,084
|
|
Loss on sale or abandonment of property and equipment
|
|
|
200
|
|
|
88
|
|
Amortization of debt issuance costs
|
|
|
107
|
|
|
86
|
|
Change in fair value of contingent consideration
|
|
|
70
|
|
|
—
|
|
Provision for bad debt expense
|
|
|
760
|
|
|
995
|
|
Loss from inventory obsolescence
|
|
|
468
|
|
|
360
|
|
Changes in certain assets and liabilities:
|
|
|
|
|
|
|
|
Receivables, net
|
|
|
(1,092)
|
|
|
(6,568)
|
|
Inventories, net
|
|
|
(5,143)
|
|
|
4,531
|
|
Prepaid expenses and other current assets
|
|
|
3,912
|
|
|
(4,195)
|
|
Accounts payable
|
|
|
(11,429)
|
|
|
(17,842)
|
|
Accrued liabilities
|
|
|
(3,923)
|
|
|
33,656
|
|
Other, net
|
|
|
(597)
|
|
|
118
|
|
Net cash provided by operating activities
|
|
|
17,565
|
|
|
14,834
|
|
|
|
|
|
|
|
|
|
Cash Flows Provided by (Used in) Investing Activities:
|
|
|
|
|
|
|
|
Purchases of property and equipment
|
|
|
(11,266)
|
|
|
(3,800)
|
|
Acquisition of businesses, net of cash acquired of $239 in 2018
|
|
|
(26,956)
|
|
|
(41,242)
|
|
Proceeds from sale of property and equipment
|
|
|
70
|
|
|
133
|
|
Repayment of notes receivable
|
|
|
13
|
|
|
32
|
|
Net cash used in investing activities
|
|
|
(38,139)
|
|
|
(44,877)
|
|
|
|
|
|
|
|
|
|
Cash Flows Provided by (Used in) Financing Activities:
|
|
|
|
|
|
|
|
Repayments of long-term debt
|
|
|
(3,125)
|
|
|
(5,000)
|
|
Proceeds from equipment notes
|
|
|
10,066
|
|
|
—
|
|
Proceeds from revolving credit facility
|
|
|
55,000
|
|
|
—
|
|
Repayment of revolving credit facility
|
|
|
(55,000)
|
|
|
—
|
|
Payment of debt issuance costs
|
|
|
(1,040)
|
|
|
—
|
|
Taxes withheld and paid on employees' equity awards
|
|
|
(4,514)
|
|
|
(1,583)
|
|
Repurchase of shares of common stock
|
|
|
—
|
|
|
(17,379)
|
|
Net cash provided by (used in) financing activities
|
|
|
1,387
|
|
|
(23,962)
|
|
|
|
|
|
|
|
|
|
Cash and Cash Equivalents
|
|
|
|
|
|
|
|
Decrease for the period
|
|
|
(19,187)
|
|
|
(54,005)
|
|
Beginning of year
|
|
|
56,521
|
|
|
134,375
|
|
End of period
|
|
$
|
37,334
|
|
$
|
80,370
|
|
|
|
|
|
|
|
|
|
Supplemental disclosure of noncash investing activities:
|
|
|
|
|
|
|
|
Accruals for property and equipment
|
|
$
|
1,116
|
|
$
|
237
|
TopBuild Corp.
Segment Data (Unaudited)
(dollars in thousands)
|
|
|
|
|
|
|
|
|
|
|
|
|
|
|
Three Months Ended March 31,
|
|
|
|
|
|
|
|
2018
|
|
2017
|
|
|
Change
|
|
Installation
|
|
|
|
|
|
|
|
|
|
|
|
Sales
|
|
$
|
329,394
|
|
$
|
290,887
|
|
|
13.2
|
%
|
|
|
|
|
|
|
|
|
|
|
|
|
|
Operating profit (loss), as reported
|
|
$
|
29,330
|
|
$
|
(8,964)
|
|
|
|
|
|
Operating margin, as reported
|
|
|
8.9
|
%
|
|
(3.1)
|
%
|
|
|
|
|
|
|
|
|
|
|
|
|
|
|
|
|
Significant legal settlement
|
|
|
—
|
|
|
30,000
|
|
|
|
|
|
Rationalization charges
|
|
|
217
|
|
|
411
|
|
|
|
|
|
Operating profit, as adjusted
|
|
$
|
29,547
|
|
$
|
21,447
|
|
|
|
|
|
Operating margin, as adjusted
|
|
|
9.0
|
%
|
|
7.4
|
%
|
|
|
|
|
|
|
|
|
|
|
|
|
|
|
|
|
Distribution
|
|
|
|
|
|
|
|
|
|
|
|
Sales
|
|
$
|
187,766
|
|
$
|
170,244
|
|
|
10.3
|
%
|
|
|
|
|
|
|
|
|
|
|
|
|
|
Operating profit, as reported
|
|
$
|
17,902
|
|
$
|
15,484
|
|
|
|
|
|
Operating margin, as reported
|
|
|
9.5
|
%
|
|
9.1
|
%
|
|
|
|
|
|
|
|
|
|
|
|
|
|
|
|
|
Rationalization charges
|
|
|
25
|
|
|
—
|
|
|
|
|
|
Operating profit, as adjusted
|
|
$
|
17,927
|
|
$
|
15,484
|
|
|
|
|
|
Operating margin, as adjusted
|
|
|
9.5
|
%
|
|
9.1
|
%
|
|
|
|
|
|
|
|
|
|
|
|
|
|
|
|
|
Total
|
|
|
|
|
|
|
|
|
|
|
|
Sales before eliminations
|
|
$
|
517,160
|
|
$
|
461,131
|
|
|
|
|
|
Intercompany eliminations
|
|
|
(25,716)
|
|
|
(19,768)
|
|
|
|
|
|
Net sales after eliminations
|
|
$
|
491,444
|
|
$
|
441,363
|
|
|
11.3
|
%
|
|
|
|
|
|
|
|
|
|
|
|
|
|
Operating profit, as reported - segment
|
|
$
|
47,232
|
|
$
|
6,520
|
|
|
|
|
|
General corporate expense, net
|
|
|
(8,893)
|
|
|
(6,682)
|
|
|
|
|
|
Intercompany eliminations and other adjustments
|
|
|
(4,446)
|
|
|
(3,301)
|
|
|
|
|
|
Operating profit (loss), as reported
|
|
$
|
33,893
|
|
$
|
(3,463)
|
|
|
|
|
|
Operating margin, as reported
|
|
|
6.9
|
%
|
|
(0.8)
|
%
|
|
|
|
|
|
|
|
|
|
|
|
|
|
|
|
|
Significant legal settlement
|
|
|
—
|
|
|
30,000
|
|
|
|
|
|
Rationalization charges†
|
|
|
797
|
|
|
1,738
|
|
|
|
|
|
Acquisition related costs
|
|
|
3,482
|
|
|
292
|
|
|
|
|
|
Operating profit, as adjusted
|
|
$
|
38,172
|
|
$
|
28,567
|
|
|
|
|
|
Operating margin, as adjusted
|
|
|
7.8
|
%
|
|
6.5
|
%
|
|
|
|
|
|
|
|
|
|
|
|
|
|
|
|
|
Share-based compensation
|
|
|
2,402
|
|
|
2,084
|
|
|
|
|
|
Depreciation and amortization
|
|
|
5,442
|
|
|
3,231
|
|
|
|
|
|
EBITDA, as adjusted
|
|
$
|
46,016
|
|
$
|
33,882
|
|
|
|
|
|
EBITDA margin, as adjusted
|
|
|
9.4
|
%
|
|
7.7
|
%
|
|
|
|
|
|
|
|
|
|
|
|
|
|
|
|
|
Sales change period over period
|
|
|
50,081
|
|
|
|
|
|
|
|
|
EBITDA, as adjusted, change period over period
|
|
|
12,134
|
|
|
|
|
|
|
|
|
EBITDA, as adjusted, as percentage of sales change
|
|
|
24.2
|
%
|
|
|
|
|
|
|
† Rationalization charges include corporate level adjustments as well as segment operating adjustments.
TopBuild Corp.
Non-GAAP Reconciliations (Unaudited)
(in thousands, except share and per common share amounts)
|
|
|
|
|
|
|
|
|
|
|
|
Three Months Ended March 31,
|
|
|
|
|
2018
|
|
2017
|
|
|
Gross Profit and Operating Profit Reconciliations
|
|
|
|
|
|
|
|
|
|
|
|
|
|
|
|
|
|
Net sales
|
|
$
|
491,444
|
|
$
|
441,363
|
|
|
|
|
|
|
|
|
|
|
|
Gross profit, as reported
|
|
$
|
111,018
|
|
$
|
101,628
|
|
|
|
|
|
|
|
|
|
|
|
Gross profit, as adjusted
|
|
$
|
111,018
|
|
$
|
101,628
|
|
|
|
|
|
|
|
|
|
|
|
Gross margin, as reported
|
|
|
22.6
|
%
|
|
23.0
|
%
|
|
Gross margin, as adjusted
|
|
|
22.6
|
%
|
|
23.0
|
%
|
|
|
|
|
|
|
|
|
|
|
Operating profit (loss), as reported
|
|
$
|
33,893
|
|
$
|
(3,463)
|
|
|
|
|
|
|
|
|
|
|
|
Significant legal settlement
|
|
|
—
|
|
|
30,000
|
|
|
Rationalization charges
|
|
|
797
|
|
|
1,738
|
|
|
Acquisition related costs
|
|
|
3,482
|
|
|
292
|
|
|
Operating profit, as adjusted
|
|
$
|
38,172
|
|
$
|
28,567
|
|
|
|
|
|
|
|
|
|
|
|
Operating margin, as reported
|
|
|
6.9
|
%
|
|
(0.8)
|
%
|
|
Operating margin, as adjusted
|
|
|
7.8
|
%
|
|
6.5
|
%
|
|
|
|
|
|
|
|
|
|
|
Income Per Common Share Reconciliation
|
|
|
|
|
|
|
|
|
|
|
|
|
|
|
|
|
|
Income (loss) before income taxes, as reported
|
|
$
|
31,603
|
|
$
|
(4,726)
|
|
|
|
|
|
|
|
|
|
|
|
Significant legal settlement
|
|
|
—
|
|
|
30,000
|
|
|
Rationalization charges
|
|
|
797
|
|
|
1,738
|
|
|
Acquisition related costs
|
|
|
3,482
|
|
|
292
|
|
|
Income before income taxes, as adjusted
|
|
|
35,882
|
|
|
27,304
|
|
|
|
|
|
|
|
|
|
|
|
Tax rate at 27% and 38% for 2018 and 2017, respectively
|
|
|
(9,688)
|
|
|
(10,376)
|
|
|
Income, as adjusted
|
|
$
|
26,194
|
|
$
|
16,928
|
|
|
|
|
|
|
|
|
|
|
|
Income per common share, as adjusted
|
|
$
|
0.73
|
|
$
|
0.46
|
|
|
|
|
|
|
|
|
|
|
|
Weighted average diluted common shares outstanding
|
|
|
35,819,242
|
|
|
37,123,245
|
|
TopBuild Corp.
Same Branch Net Sales and Adjusted EBITDA (Unaudited)
(dollars in thousands)
|
|
|
|
|
|
|
|
|
|
|
|
Three Months Ended March 31,
|
|
|
|
|
2018
|
|
2017
|
|
|
Net sales
|
|
|
|
|
|
|
|
|
Same branch
|
|
$
|
470,876
|
|
$
|
433,777
|
|
|
Acquired
|
|
|
20,568
|
|
|
7,586
|
|
|
Total
|
|
$
|
491,444
|
|
$
|
441,363
|
|
|
|
|
|
|
|
|
|
|
|
EBITDA, as adjusted
|
|
|
|
|
|
|
|
|
Same branch
|
|
$
|
44,758
|
|
$
|
33,453
|
|
|
Acquired
|
|
|
1,258
|
|
|
429
|
|
|
Total
|
|
$
|
46,016
|
|
$
|
33,882
|
|
|
|
|
|
|
|
|
|
|
|
Total EBITDA, as adjusted, as percentage of total sales change
|
|
|
24.2
|
%
|
|
|
|
|
|
|
|
|
|
|
|
|
|
Same branch EBITDA, as adjusted, as percentage of sales change
|
|
|
30.5
|
%
|
|
41.4
|
%
|
|
Acquired EBITDA, as adjusted, as percentage of sales change
|
|
|
6.4
|
%
|
|
5.7
|
%
|
|
|
|
|
|
|
|
|
|
|
Same branch change in EBITDA, as adjusted, and total prior year EBITDA (inclusive of prior year Acquired EBITDA), as adjusted, as a percentage of the change in current period same branch sales and total prior year sales (inclusive of prior year Acquired sales)
|
|
|
36.9
|
%
|
|
41.4
|
%
|
|
Acquired EBITDA, as adjusted, as a percentage of acquired sales
|
|
|
6.1
|
%
|
|
5.7
|
%
|
TopBuild Corp.
Reconciliation of EBITDA to Net Income (Loss) (Unaudited)
(dollars in thousands)
|
|
|
|
|
|
|
|
|
|
|
Three Months Ended March 31,
|
|
|
|
2018
|
|
2017
|
|
Net income (loss), as reported
|
|
$
|
26,388
|
|
$
|
(1,710)
|
|
Adjustments to arrive at EBITDA, as adjusted:
|
|
|
|
|
|
|
|
Interest expense and other, net
|
|
|
2,290
|
|
|
1,263
|
|
Income tax expense (benefit)
|
|
|
5,215
|
|
|
(3,016)
|
|
Depreciation and amortization
|
|
|
5,442
|
|
|
3,231
|
|
Share-based compensation
|
|
|
2,402
|
|
|
2,084
|
|
Significant legal settlement
|
|
|
—
|
|
|
30,000
|
|
Rationalization charges
|
|
|
797
|
|
|
1,738
|
|
Acquisition related costs
|
|
|
3,482
|
|
|
292
|
|
EBITDA, as adjusted
|
|
$
|
46,016
|
|
$
|
33,882
|
TopBuild Corp.
2018 Estimated Adjusted EBITDA Range (Unaudited)
(dollars in millions)
|
|
|
|
|
|
|
|
|
Twelve Months Ending December 31, 2018
|
|
|
|
Low
|
|
|
High
|
|
Estimated net income
|
$
|
120.9
|
|
$
|
142.8
|
|
Adjustments to arrive at estimated EBITDA, as adjusted:
|
|
|
|
|
|
|
Interest expense and other, net
|
|
29.7
|
|
|
28.1
|
|
Income tax expense
|
|
44.7
|
|
|
52.8
|
|
Depreciation and amortization
|
|
39.5
|
|
|
36.3
|
|
Share-based compensation
|
|
13.9
|
|
|
11.7
|
|
Rationalization charges
|
|
0.8
|
|
|
0.8
|
|
Acquisition related costs
|
|
3.5
|
|
|
3.5
|
|
Estimated costs to realize synergies
|
|
10.0
|
|
|
8.0
|
|
Estimated EBITDA, as adjusted
|
$
|
263.0
|
|
$
|
284.0
|