Exhibit 99.1

NYSE:BLD
A leading installer and distributor of insulation and building material products
to the U.S. construction industry.
TopBuild Reports Fourth Quarter and Full Year 2019 Results
|
·
| |
Net sales increase 3.6% |
|
·
| |
Gross margin expands 120 basis points |
|
·
| |
11.5% operating margin, 11.6% on an adjusted basis, up 110 basis points |
|
·
| |
Adjusted EBITDA margin expands 110 basis points to 14.0% |
|
·
| |
$1.36 net income per diluted share, $1.48 on an adjusted basis |
Provides 2020 Sales and Adjusted EBITDA Guidance
Fourth Quarter Financial Highlights
(unless otherwise indicated, comparisons are to the quarter ended December 31, 2018)
|
ü
| |
Net sales increased 3.6% to $662.3 million, driven by increases in price and residential and commercial volume and acquisitions, partially offset by a higher mix of multi-family and smaller, single-family homes which generate lower revenue per unit. |
|
ü
| |
Gross margin expanded 120 basis points to 25.9%. |
|
ü
| |
Operating profit was $76.4 million, compared to $65.2 million. On an adjusted basis, operating profit was $76.6 million, compared to $67.2 million, a 14.1% improvement. |
|
ü
| |
Operating margin was 11.5%. Adjusted operating margin improved 110 basis points to 11.6%. |
|
ü
| |
Net income was $46.0 million, or $1.36 per diluted share, compared to $38.6 million, or $1.10 per diluted share. |
|
ü
| |
Adjusted net income was $50.0 million, or $1.48 per diluted share, compared to $42.2 million, or $1.20 per diluted share. |
NYSE:BLD February 25, 2020 topbuild.com
|
ü
| |
Adjusted EBITDA was $92.5 million, compared to $82.5 million, a 12.2% increase and adjusted EBITDA margin improved 110 basis points to 14.0%. Incremental adjusted EBITDA margin was 44.0%. |
|
ü
| |
At December 31, 2019, the Company had cash and cash equivalents of $184.8 million, availability under its revolving credit facility of $188.6 million for total liquidity of $373.4 million. |
Full Year 2019 Financial Highlights
(unless otherwise indicated, comparisons are to twelve months ended December 31, 2018)
|
ü
| |
Net sales increased 10.1% to $2,624.1 million. On a same branch basis, revenue increased 4.6% to $2,494.5 million. |
|
ü
| |
Gross margin expanded 180 basis points to 26.0%. |
|
ü
| |
Operating profit was $289.5 million, compared to operating profit of $209.0 million. On an adjusted basis, operating profit was $292.7 million, compared to $232.6 million, a 25.8% improvement. |
|
ü
| |
Operating margin was 11.0%, up 220 basis points. Adjusted operating margin improved 140 basis points to 11.2%. |
|
ü
| |
Net income was $191.0 million, or $5.56 per diluted share, compared to $134.8 million, or $3.78 per diluted share. Adjusted net income was $188.9 million, or $5.49 per diluted share, compared to $149.3 million, or $4.19 per diluted share. |
|
ü
| |
Adjusted EBITDA was $359.1 million, compared to $283.4 million, a 26.7% increase and adjusted EBITDA margin improved 180 basis points to 13.7%. Incremental adjusted EBITDA margin was 31.6%. |
|
ü
| |
On a same branch basis, adjusted EBITDA grew 17.9% to $334.1 million and adjusted incremental EBITDA margin was 46.1%. |
|
ü
| |
Acquisitions contributed $129.6 million of revenue. Incremental adjusted EBITDA related to these acquisitions was 19.2%. |
NYSE:BLD February 25, 2020 topbuild.com
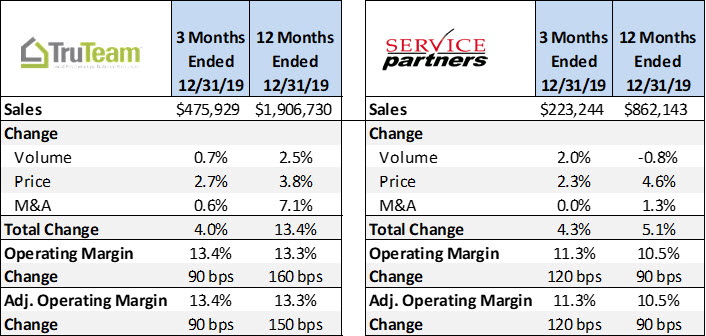
Operating Segment Highlights ($ in 000s)
(comparisons are to the period ended December 31, 2018)
Capital Allocation
Acquisitions
In 2019, the Company completed one acquisition, Viking Insulation, based in Burbank, California. Viking is expected to generate approximately $9.0 million in annual revenue.
In February 2020, the Company acquired Hunter Insulation, an installation company based in Long Island, New York and Cooper Glass, a commercial glass company serving the Memphis market. Combined, these companies are expected to contribute approximately $19 million of annual revenue.
Share Repurchase Program
In 2019, the Company repurchased a total of 1,291,771 shares of its common stock for approximately $110.9 million. This includes the receipt of 392,501 shares related to its $50 million accelerated share repurchase (“ASR”) program announced October 2019. The ASR is expected to settle no later than the end of the first quarter of 2020.
NYSE:BLD February 25, 2020 topbuild.com
2020 Sales and Adjusted EBITDA Guidance (1)
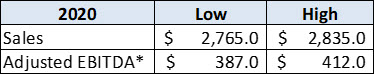
*See table for adjusted EBITDA reconciliation
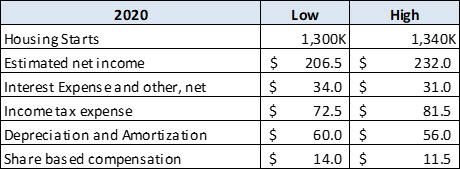
Assumptions
($ in millions)
Long-Term Targets (3-Years) (1)
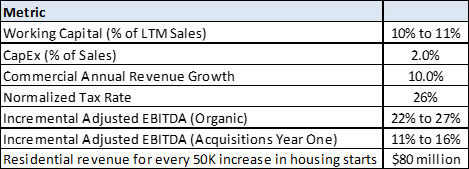
(1) This guidance and long-term targets reflect management’s current view of present and future market conditions and are based on assumptions such as housing starts, general and administrative expenses, weighted average diluted shares outstanding and interest rates. These targets do not include any effects related to potential acquisitions or divestitures that may occur after the date of this press release. A reconciliation of non-GAAP targets to corresponding GAAP measures is not available on a forward-looking basis without unreasonable effort due to the uncertainty regarding, and the potential variability of, the costs and expenses that may be incurred in the future and therefore, cannot be reasonably predicted. The effect of these excluded items may be significant. Factors that could cause actual long-term results to differ materially from TopBuild’s current expectations are discussed below and are also detailed in the Company’s 2019 Annual Report on Form 10-K and subsequent SEC reports.
Additional Information
Quarterly supplemental materials, including a presentation that will be referenced on today’s conference call, are available on the “Investors” section of the Company’s website at www.topbuild.com.
NYSE:BLD February 25, 2020 topbuild.com
Conference Call
A conference call to discuss fourth quarter 2019 financial results is scheduled for today, Tuesday, February 25, at 9:00 a.m. Eastern Time. The call may be accessed by dialing (888) 225-2706. The conference call will be webcast simultaneously on the “Investors” section of the Company’s website at www.topbuild.com.
About TopBuild
TopBuild Corp., a Fortune 1000 Company headquartered in Daytona Beach, Florida, is a leading installer and distributor of insulation and building material products to the U.S. construction industry. We provide insulation and building material services nationwide through TruTeam®, which has approximately 200 branches, and through Service Partners® which distributes insulation and building material products from approximately 75 branches. We leverage our national footprint to gain economies of scale while capitalizing on our local market presence to forge strong relationships with our customers. To learn more about TopBuild please visit our website at www.topbuild.com.
Use of Non-GAAP Financial Measures
Adjusted EBITDA, incremental EBITDA margin, adjusted EBITDA margin, the “adjusted” financial measures presented above, and figures presented on a “same branch basis” are not calculated in accordance with U.S. generally accepted accounting principles (“GAAP”). The Company believes that these non-GAAP financial measures, which are used in managing the business, may provide users of this financial information with additional meaningful comparisons between current results and results in prior periods. We define same branch sales as sales from branches in operation for at least 12 full calendar months. Such non-GAAP financial measures are reconciled to their closest GAAP financial measures in tables contained in this press release. Non-GAAP financial measures should be viewed in addition to, and not as an alternative for, the Company’s reported results under GAAP. Additional information may be found in the Company’s filings with the Securities and Exchange Commission which are available on TopBuild’s website under “Investors” at www.topbuild.com.
Safe Harbor Statement
This press release contains “forward-looking statements” within the meaning of the Private Securities Litigation Reform Act. These forward-looking statements may address, among other things, our expected financial and operational results, the related assumptions underlying our expected results, and our plan to repurchase our common stock under the proposed accelerated stock repurchase transaction. These forward-looking statements are distinguished by use of words such as “will,” “would,” “anticipate,” “expect,” “believe,” “designed,” “plan,” or “intend,” the negative of these terms, and similar references to future periods. These views involve risks and uncertainties that are difficult to predict and, accordingly, our actual results may differ materially from the results discussed in our forward-looking statements. Our forward-looking statements contained herein speak only as of the date of this press release. Factors or events that we cannot predict, including those described in the risk factors contained in our filings with the Securities and Exchange Commission, may cause our actual results to differ from those expressed in forward-looking statements. Although TopBuild believes the expectations reflected in such forward-looking statements are based on reasonable assumptions, the Company can give no assurance that its expectations will be achieved and it undertakes no obligation to update publicly any forward-looking statements as a result of new information, future events, or otherwise, except as required by applicable law.
Investor Relations and Media Contact
Tabitha Zane
tabitha.zane@topbuild.com
386-763-8801
(tables follow)
NYSE:BLD February 25, 2020 topbuild.com
TopBuild Corp.
Condensed Consolidated Statements of Operations
(in thousands, except share and per common share amounts)
|
|
|
|
|
|
|
|
|
|
|
|
|
|
|
|
|
Three Months Ended December 31,
|
|
Year Ended December 31,
|
|
|
|
2019
|
|
2018
|
|
2019
|
|
2018
|
|
Net sales
|
|
$
|
662,349
|
|
$
|
639,547
|
|
$
|
2,624,121
|
|
$
|
2,384,249
|
|
Cost of sales
|
|
|
491,030
|
|
|
481,321
|
|
|
1,942,854
|
|
|
1,808,097
|
|
Gross profit
|
|
|
171,319
|
|
|
158,226
|
|
|
681,267
|
|
|
576,152
|
|
|
|
|
|
|
|
|
|
|
|
|
|
|
|
Selling, general, and administrative expense
|
|
|
94,898
|
|
|
93,065
|
|
|
391,744
|
|
|
367,199
|
|
Operating profit
|
|
|
76,421
|
|
|
65,161
|
|
|
289,523
|
|
|
208,953
|
|
|
|
|
|
|
|
|
|
|
|
|
|
|
|
Other income (expense), net:
|
|
|
|
|
|
|
|
|
|
|
|
|
|
Interest expense
|
|
|
(9,083)
|
|
|
(9,661)
|
|
|
(37,823)
|
|
|
(28,687)
|
|
Other, net
|
|
|
566
|
|
|
266
|
|
|
2,078
|
|
|
558
|
|
Other expense, net
|
|
|
(8,517)
|
|
|
(9,395)
|
|
|
(35,745)
|
|
|
(28,129)
|
|
Income before income taxes
|
|
|
67,904
|
|
|
55,766
|
|
|
253,778
|
|
|
180,824
|
|
|
|
|
|
|
|
|
|
|
|
|
|
|
|
Income tax expense
|
|
|
(21,919)
|
|
|
(17,213)
|
|
|
(62,783)
|
|
|
(46,072)
|
|
Net income
|
|
$
|
45,985
|
|
$
|
38,553
|
|
$
|
190,995
|
|
$
|
134,752
|
|
|
|
|
|
|
|
|
|
|
|
|
|
|
|
Net income per common share:
|
|
|
|
|
|
|
|
|
|
|
|
|
|
Basic
|
|
$
|
1.38
|
|
$
|
1.12
|
|
$
|
5.65
|
|
$
|
3.86
|
|
Diluted
|
|
$
|
1.36
|
|
$
|
1.10
|
|
$
|
5.56
|
|
$
|
3.78
|
|
|
|
|
|
|
|
|
|
|
|
|
|
|
|
Weighted average shares outstanding:
|
|
|
|
|
|
|
|
|
|
|
|
|
|
Basic
|
|
|
33,297,613
|
|
|
34,436,518
|
|
|
33,806,104
|
|
|
34,921,318
|
|
Diluted
|
|
|
33,886,904
|
|
|
35,012,535
|
|
|
34,376,555
|
|
|
35,613,319
|
NYSE:BLD February 25, 2020 topbuild.com
TopBuild Corp.
Condensed Consolidated Balance Sheets and Other Financial Data
(dollars in thousands)
|
|
|
|
|
|
|
|
|
|
|
As of December 31,
|
|
|
|
2019
|
|
2018
|
|
ASSETS
|
|
|
|
|
|
|
|
Current assets:
|
|
|
|
|
|
|
|
Cash and cash equivalents
|
|
$
|
184,807
|
|
$
|
100,929
|
|
Receivables, net of an allowance for doubtful accounts of $4,854 and $3,676 at December 31, 2019, and December 31, 2018, respectively
|
|
|
428,844
|
|
|
407,106
|
|
Inventories, net
|
|
|
149,078
|
|
|
168,977
|
|
Prepaid expenses and other current assets
|
|
|
17,098
|
|
|
27,685
|
|
Total current assets
|
|
|
779,827
|
|
|
704,697
|
|
|
|
|
|
|
|
|
|
Right of use assets
|
|
|
87,134
|
|
|
—
|
|
Property and equipment, net
|
|
|
178,080
|
|
|
167,961
|
|
Goodwill
|
|
|
1,367,918
|
|
|
1,364,016
|
|
Other intangible assets, net
|
|
|
181,122
|
|
|
199,387
|
|
Deferred tax assets, net
|
|
|
4,259
|
|
|
13,176
|
|
Other assets
|
|
|
5,623
|
|
|
5,294
|
|
Total assets
|
|
$
|
2,603,963
|
|
$
|
2,454,531
|
|
|
|
|
|
|
|
|
|
LIABILITIES
|
|
|
|
|
|
|
|
Current liabilities:
|
|
|
|
|
|
|
|
Accounts payable
|
|
$
|
307,970
|
|
$
|
313,172
|
|
Current portion of long-term debt
|
|
|
34,272
|
|
|
26,852
|
|
Accrued liabilities
|
|
|
98,418
|
|
|
104,236
|
|
Short-term lease liabilities
|
|
|
36,094
|
|
|
—
|
|
Total current liabilities
|
|
|
476,754
|
|
|
444,260
|
|
|
|
|
|
|
|
|
|
Long-term debt
|
|
|
697,955
|
|
|
716,622
|
|
Deferred tax liabilities, net
|
|
|
175,263
|
|
|
176,212
|
|
Long-term portion of insurance reserves
|
|
|
45,605
|
|
|
43,434
|
|
Long-term lease liabilities
|
|
|
54,010
|
|
|
—
|
|
Other liabilities
|
|
|
1,487
|
|
|
1,905
|
|
Total liabilities
|
|
|
1,451,074
|
|
|
1,382,433
|
|
|
|
|
|
|
|
|
|
EQUITY
|
|
|
1,152,889
|
|
|
1,072,098
|
|
Total liabilities and equity
|
|
$
|
2,603,963
|
|
$
|
2,454,531
|
|
|
|
|
|
|
|
|
|
|
|
|
As of December 31,
|
|
|
|
|
2019
|
|
2018
|
|
|
Other Financial Data
|
|
|
|
|
|
|
|
|
Receivable days †
|
|
|
53
|
|
|
51
|
|
|
Inventory days †
|
|
|
28
|
|
|
34
|
|
|
Accounts payable days †
|
|
|
80
|
|
|
80
|
|
|
Receivables, net plus inventories, net less accounts payable †
|
|
$
|
269,952
|
|
$
|
262,911
|
|
|
Receivables, net plus inventories, net less accounts payable as a percent of sales (TTM)‡
|
|
|
10.3
|
%
|
|
10.4
|
%
|
|
|
|
† Adjusted for remaining acquisition day one balance sheet items.
‡ Trailing 12 months sales have been adjusted for the pro forma effect of acquired branches.
|
NYSE:BLD February 25, 2020 topbuild.com
TopBuild Corp.
Condensed Consolidated Statements of Cash Flows
(dollars in thousands)
|
|
|
|
|
|
|
|
|
|
|
Year Ended December 31,
|
|
|
|
2019
|
|
2018
|
|
Cash Flows Provided by (Used in) Operating Activities:
|
|
|
|
|
|
|
|
Net income
|
|
$
|
190,995
|
|
$
|
134,752
|
|
Adjustments to reconcile net income to net cash provided by operating activities:
|
|
|
|
|
|
|
|
Depreciation and amortization
|
|
|
52,700
|
|
|
39,419
|
|
Share-based compensation
|
|
|
13,658
|
|
|
11,317
|
|
Loss on sale or abandonment of property and equipment
|
|
|
1,399
|
|
|
1,204
|
|
Amortization of debt issuance costs
|
|
|
1,558
|
|
|
1,201
|
|
Provision for bad debt expense
|
|
|
7,065
|
|
|
3,240
|
|
Loss from inventory obsolescence
|
|
|
2,622
|
|
|
2,187
|
|
Deferred income taxes, net
|
|
|
8,888
|
|
|
12,936
|
|
Change in certain assets and liabilities
|
|
|
|
|
|
|
|
Receivables, net
|
|
|
(27,146)
|
|
|
(35,522)
|
|
Inventories, net
|
|
|
17,433
|
|
|
(23,297)
|
|
Prepaid expenses and other current assets
|
|
|
9,361
|
|
|
(8,360)
|
|
Accounts payable
|
|
|
(5,124)
|
|
|
29,687
|
|
Accrued liabilities
|
|
|
(2,690)
|
|
|
(660)
|
|
Other, net
|
|
|
1,058
|
|
|
(932)
|
|
Net cash provided by operating activities
|
|
|
271,777
|
|
|
167,172
|
|
|
|
|
|
|
|
|
|
Cash Flows Provided by (Used in) Investing Activities:
|
|
|
|
|
|
|
|
Purchases of property and equipment
|
|
|
(45,536)
|
|
|
(52,504)
|
|
Acquisition of businesses, net of cash acquired of $15,756 in 2018
|
|
|
(6,952)
|
|
|
(500,202)
|
|
Proceeds from sale of property and equipment
|
|
|
2,321
|
|
|
849
|
|
Other, net
|
|
|
25
|
|
|
38
|
|
Net cash used in investing activities
|
|
|
(50,142)
|
|
|
(551,819)
|
|
|
|
|
|
|
|
|
|
Cash Flows Provided by (Used in) Financing Activities:
|
|
|
|
|
|
|
|
Proceeds from issuance of long-term debt
|
|
|
14,989
|
|
|
526,604
|
|
Repayment of long-term debt
|
|
|
(27,793)
|
|
|
(18,399)
|
|
Payment of debt issuance costs
|
|
|
—
|
|
|
(7,819)
|
|
Proceeds from revolving credit facility
|
|
|
—
|
|
|
90,000
|
|
Repayment of revolving credit facility
|
|
|
—
|
|
|
(90,000)
|
|
Taxes withheld and paid on employees' equity awards
|
|
|
(12,951)
|
|
|
(5,465)
|
|
Repurchase of shares of common stock
|
|
|
(110,911)
|
|
|
(65,025)
|
|
Payment of contingent consideration
|
|
|
(1,091)
|
|
|
(841)
|
|
Net cash (used in) provided by financing activities
|
|
|
(137,757)
|
|
|
429,055
|
|
|
|
|
|
|
|
|
|
Cash and Cash Equivalents
|
|
|
|
|
|
|
|
Increase for the period
|
|
|
83,878
|
|
|
44,408
|
|
Beginning of period
|
|
|
100,929
|
|
|
56,521
|
|
End of period
|
|
$
|
184,807
|
|
$
|
100,929
|
|
|
|
|
|
|
|
|
|
Supplemental disclosure of cash paid for:
|
|
|
|
|
|
|
|
Interest on long-term debt
|
|
$
|
36,244
|
|
$
|
23,733
|
|
Income taxes
|
|
|
43,310
|
|
|
39,010
|
|
|
|
|
|
|
|
|
|
Supplemental disclosure of noncash activities:
|
|
|
|
|
|
|
|
Leased assets obtained in exchange for new operating lease liabilities
|
|
$
|
128,838
|
|
$
|
—
|
|
Accruals for property and equipment
|
|
|
542
|
|
|
860
|
NYSE:BLD February 25, 2020 topbuild.com
TopBuild Corp.
Segment Data
(dollars in thousands)
|
|
|
|
|
|
|
|
|
|
|
|
|
|
|
|
|
|
|
|
|
|
|
|
|
|
Three Months Ended December 31,
|
|
|
|
|
|
|
Year Ended December 31,
|
|
|
|
|
|
|
|
2019
|
|
2018
|
|
Change
|
|
|
|
2019
|
|
2018
|
|
Change
|
|
|
TruTeam
|
|
|
|
|
|
|
|
|
|
|
|
|
|
|
|
|
|
|
|
|
|
|
Sales
|
|
$
|
475,929
|
|
$
|
457,610
|
|
|
4.0
|
%
|
|
|
$
|
1,906,730
|
|
$
|
1,680,967
|
|
|
13.4
|
%
|
|
|
|
|
|
|
|
|
|
|
|
|
|
|
|
|
|
|
|
|
|
|
|
|
Operating profit, as reported
|
|
$
|
63,661
|
|
$
|
57,016
|
|
|
|
|
|
|
$
|
253,230
|
|
$
|
196,986
|
|
|
|
|
|
Operating margin, as reported
|
|
|
13.4
|
%
|
|
12.5
|
%
|
|
|
|
|
|
|
13.3
|
%
|
|
11.7
|
%
|
|
|
|
|
|
|
|
|
|
|
|
|
|
|
|
|
|
|
|
|
|
|
|
|
|
|
|
Rationalization charges
|
|
|
(24)
|
|
|
216
|
|
|
|
|
|
|
|
159
|
|
|
845
|
|
|
|
|
|
Acquisition related costs
|
|
|
177
|
|
|
—
|
|
|
|
|
|
|
|
636
|
|
|
—
|
|
|
|
|
|
Operating profit, as adjusted
|
|
$
|
63,814
|
|
$
|
57,232
|
|
|
|
|
|
|
$
|
254,025
|
|
$
|
197,831
|
|
|
|
|
|
Operating margin, as adjusted
|
|
|
13.4
|
%
|
|
12.5
|
%
|
|
|
|
|
|
|
13.3
|
%
|
|
11.8
|
%
|
|
|
|
|
|
|
|
|
|
|
|
|
|
|
|
|
|
|
|
|
|
|
|
|
|
|
|
Service Partners
|
|
|
|
|
|
|
|
|
|
|
|
|
|
|
|
|
|
|
|
|
|
|
Sales
|
|
$
|
223,244
|
|
$
|
213,974
|
|
|
4.3
|
%
|
|
|
$
|
862,143
|
|
$
|
820,309
|
|
|
5.1
|
%
|
|
|
|
|
|
|
|
|
|
|
|
|
|
|
|
|
|
|
|
|
|
|
|
|
Operating profit, as reported
|
|
$
|
25,234
|
|
$
|
21,598
|
|
|
|
|
|
|
$
|
90,388
|
|
$
|
78,739
|
|
|
|
|
|
Operating margin, as reported
|
|
|
11.3
|
%
|
|
10.1
|
%
|
|
|
|
|
|
|
10.5
|
%
|
|
9.6
|
%
|
|
|
|
|
|
|
|
|
|
|
|
|
|
|
|
|
|
|
|
|
|
|
|
|
|
|
|
Rationalization charges
|
|
|
—
|
|
|
—
|
|
|
|
|
|
|
|
109
|
|
|
159
|
|
|
|
|
|
Operating profit, as adjusted
|
|
$
|
25,234
|
|
$
|
21,598
|
|
|
|
|
|
|
$
|
90,497
|
|
$
|
78,898
|
|
|
|
|
|
Operating margin, as adjusted
|
|
|
11.3
|
%
|
|
10.1
|
%
|
|
|
|
|
|
|
10.5
|
%
|
|
9.6
|
%
|
|
|
|
|
|
|
|
|
|
|
|
|
|
|
|
|
|
|
|
|
|
|
|
|
|
|
|
Total
|
|
|
|
|
|
|
|
|
|
|
|
|
|
|
|
|
|
|
|
|
|
|
Sales before eliminations
|
|
$
|
699,173
|
|
$
|
671,584
|
|
|
|
|
|
|
$
|
2,768,873
|
|
$
|
2,501,276
|
|
|
|
|
|
Intercompany eliminations
|
|
|
(36,824)
|
|
|
(32,037)
|
|
|
|
|
|
|
|
(144,752)
|
|
|
(117,027)
|
|
|
|
|
|
Net sales after eliminations
|
|
$
|
662,349
|
|
$
|
639,547
|
|
|
3.6
|
%
|
|
|
$
|
2,624,121
|
|
$
|
2,384,249
|
|
|
10.1
|
%
|
|
|
|
|
|
|
|
|
|
|
|
|
|
|
|
|
|
|
|
|
|
|
|
|
Operating profit, as reported - segments
|
|
$
|
88,895
|
|
$
|
78,614
|
|
|
|
|
|
|
$
|
343,618
|
|
$
|
275,725
|
|
|
|
|
|
General corporate expense, net
|
|
|
(6,568)
|
|
|
(7,936)
|
|
|
|
|
|
|
|
(30,174)
|
|
|
(45,873)
|
|
|
|
|
|
Intercompany eliminations
|
|
|
(5,906)
|
|
|
(5,517)
|
|
|
|
|
|
|
|
(23,921)
|
|
|
(20,899)
|
|
|
|
|
|
Operating profit, as reported
|
|
$
|
76,421
|
|
$
|
65,161
|
|
|
|
|
|
|
$
|
289,523
|
|
$
|
208,953
|
|
|
|
|
|
Operating margin, as reported
|
|
|
11.5
|
%
|
|
10.2
|
%
|
|
|
|
|
|
|
11.0
|
%
|
|
8.8
|
%
|
|
|
|
|
|
|
|
|
|
|
|
|
|
|
|
|
|
|
|
|
|
|
|
|
|
|
|
Rationalization charges †
|
|
|
15
|
|
|
929
|
|
|
|
|
|
|
|
1,992
|
|
|
7,736
|
|
|
|
|
|
Acquisition related costs
|
|
|
166
|
|
|
1,066
|
|
|
|
|
|
|
|
1,200
|
|
|
15,925
|
|
|
|
|
|
Operating profit, as adjusted
|
|
$
|
76,602
|
|
$
|
67,156
|
|
|
|
|
|
|
$
|
292,715
|
|
$
|
232,614
|
|
|
|
|
|
Operating margin, as adjusted
|
|
|
11.6
|
%
|
|
10.5
|
%
|
|
|
|
|
|
|
11.2
|
%
|
|
9.8
|
%
|
|
|
|
|
|
|
|
|
|
|
|
|
|
|
|
|
|
|
|
|
|
|
|
|
|
|
|
Share-based compensation
|
|
|
2,246
|
|
|
3,072
|
|
|
|
|
|
|
|
13,658
|
|
|
11,317
|
|
|
|
|
|
Depreciation and amortization
|
|
|
13,696
|
|
|
12,286
|
|
|
|
|
|
|
|
52,700
|
|
|
39,419
|
|
|
|
|
|
EBITDA, as adjusted
|
|
$
|
92,544
|
|
$
|
82,514
|
|
|
|
|
|
|
$
|
359,073
|
|
$
|
283,350
|
|
|
|
|
|
EBITDA margin, as adjusted
|
|
|
14.0
|
%
|
|
12.9
|
%
|
|
|
|
|
|
|
13.7
|
%
|
|
11.9
|
%
|
|
|
|
|
|
|
|
|
|
|
|
|
|
|
|
|
|
|
|
|
|
|
|
|
|
|
|
Sales change period over period
|
|
|
22,802
|
|
|
|
|
|
|
|
|
|
|
239,872
|
|
|
|
|
|
|
|
|
EBITDA, as adjusted, change period over period
|
|
|
10,030
|
|
|
|
|
|
|
|
|
|
|
75,723
|
|
|
|
|
|
|
|
|
EBITDA, as adjusted, as percentage of sales change
|
|
|
44.0
|
%
|
|
|
|
|
|
|
|
|
|
31.6
|
%
|
|
|
|
|
|
|
† Rationalization charges include corporate level adjustments as well as segment operating adjustments.
NYSE:BLD February 25, 2020 topbuild.com
TopBuild Corp.
Non-GAAP Reconciliations
(in thousands, except share and per common share amounts)
|
|
|
|
|
|
|
|
|
|
|
|
|
|
|
|
|
|
Three Months Ended December 31,
|
|
Year Ended December 31,
|
|
|
|
|
2019
|
|
2018
|
|
2019
|
|
2018
|
|
|
Gross Profit and Operating Profit Reconciliations
|
|
|
|
|
|
|
|
|
|
|
|
|
|
|
|
|
|
|
|
|
|
|
|
|
|
|
|
|
|
Net sales
|
|
$
|
662,349
|
|
$
|
639,547
|
|
$
|
2,624,121
|
|
$
|
2,384,249
|
|
|
|
|
|
|
|
|
|
|
|
|
|
|
|
|
|
Gross profit, as reported
|
|
$
|
171,319
|
|
$
|
158,226
|
|
$
|
681,267
|
|
$
|
576,152
|
|
|
|
|
|
|
|
|
|
|
|
|
|
|
|
|
|
Rationalization charges
|
|
|
—
|
|
|
—
|
|
|
—
|
|
|
176
|
|
|
Gross profit, as adjusted
|
|
$
|
171,319
|
|
$
|
158,226
|
|
$
|
681,267
|
|
$
|
576,328
|
|
|
|
|
|
|
|
|
|
|
|
|
|
|
|
|
|
Gross margin, as reported
|
|
|
25.9
|
%
|
|
24.7
|
%
|
|
26.0
|
%
|
|
24.2
|
%
|
|
Gross margin, as adjusted
|
|
|
25.9
|
%
|
|
24.7
|
%
|
|
26.0
|
%
|
|
24.2
|
%
|
|
|
|
|
|
|
|
|
|
|
|
|
|
|
|
|
Operating profit, as reported
|
|
$
|
76,421
|
|
$
|
65,161
|
|
$
|
289,523
|
|
$
|
208,953
|
|
|
|
|
|
|
|
|
|
|
|
|
|
|
|
|
|
Rationalization charges
|
|
|
15
|
|
|
929
|
|
|
1,992
|
|
|
7,736
|
|
|
Acquisition related costs
|
|
|
166
|
|
|
1,066
|
|
|
1,200
|
|
|
15,925
|
|
|
Operating profit, as adjusted
|
|
$
|
76,602
|
|
$
|
67,156
|
|
$
|
292,715
|
|
$
|
232,614
|
|
|
|
|
|
|
|
|
|
|
|
|
|
|
|
|
|
Operating margin, as reported
|
|
|
11.5
|
%
|
|
10.2
|
%
|
|
11.0
|
%
|
|
8.8
|
%
|
|
Operating margin, as adjusted
|
|
|
11.6
|
%
|
|
10.5
|
%
|
|
11.2
|
%
|
|
9.8
|
%
|
|
|
|
|
|
|
|
|
|
|
|
|
|
|
|
|
Income Per Common Share Reconciliation
|
|
|
|
|
|
|
|
|
|
|
|
|
|
|
|
|
|
|
|
|
|
|
|
|
|
|
|
|
|
Income before income taxes, as reported
|
|
$
|
67,904
|
|
$
|
55,766
|
|
$
|
253,778
|
|
$
|
180,824
|
|
|
|
|
|
|
|
|
|
|
|
|
|
|
|
|
|
Rationalization charges
|
|
|
15
|
|
|
929
|
|
|
1,992
|
|
|
7,736
|
|
|
Acquisition related costs
|
|
|
166
|
|
|
1,066
|
|
|
1,200
|
|
|
15,925
|
|
|
Income before income taxes, as adjusted
|
|
|
68,085
|
|
|
57,761
|
|
|
256,970
|
|
|
204,485
|
|
|
|
|
|
|
|
|
|
|
|
|
|
|
|
|
|
Tax rate at 26.5% and 27.0% for 2019 and 2018, respectively
|
|
|
(18,043)
|
|
|
(15,595)
|
|
|
(68,097)
|
|
|
(55,211)
|
|
|
Income, as adjusted
|
|
$
|
50,042
|
|
$
|
42,166
|
|
$
|
188,873
|
|
$
|
149,274
|
|
|
|
|
|
|
|
|
|
|
|
|
|
|
|
|
|
Income per common share, as adjusted
|
|
$
|
1.48
|
|
$
|
1.20
|
|
$
|
5.49
|
|
$
|
4.19
|
|
|
|
|
|
|
|
|
|
|
|
|
|
|
|
|
|
Weighted average diluted common shares outstanding
|
|
|
33,886,904
|
|
|
35,012,535
|
|
|
34,376,555
|
|
|
35,613,319
|
|
NYSE:BLD February 25, 2020 topbuild.com
TopBuild Corp.
Same Branch and Acquisition Net Sales and Adjusted EBITDA
(dollars in thousands)
|
|
|
|
|
|
|
|
|
|
|
|
|
|
|
|
|
|
Three Months Ended December 31,
|
|
Year Ended December 31,
|
|
|
|
|
2019
|
|
2018
|
|
2019
|
|
2018
|
|
|
Net sales
|
|
|
|
|
|
|
|
|
|
|
|
|
|
|
Same branch:
|
|
|
|
|
|
|
|
|
|
|
|
|
|
|
Installation segment
|
|
$
|
473,298
|
|
$
|
457,610
|
|
$
|
1,787,357
|
|
$
|
1,680,967
|
|
|
Distribution segment
|
|
|
223,244
|
|
|
213,974
|
|
|
851,073
|
|
|
820,309
|
|
|
Eliminations
|
|
|
(36,824)
|
|
|
(32,037)
|
|
|
(143,890)
|
|
|
(117,027)
|
|
|
Total same branch
|
|
|
659,718
|
|
|
639,547
|
|
|
2,494,540
|
|
|
2,384,249
|
|
|
|
|
|
|
|
|
|
|
|
|
|
|
|
|
|
Acquisitions (a):
|
|
|
|
|
|
|
|
|
|
|
|
|
|
|
Installation segment
|
|
$
|
2,631
|
|
$
|
—
|
|
$
|
119,373
|
|
$
|
—
|
|
|
Distribution segment
|
|
|
—
|
|
|
—
|
|
|
11,070
|
|
|
—
|
|
|
Eliminations
|
|
|
—
|
|
|
—
|
|
|
(862)
|
|
|
—
|
|
|
Total acquisitions
|
|
|
2,631
|
|
|
—
|
|
|
129,581
|
|
|
—
|
|
|
Total
|
|
$
|
662,349
|
|
$
|
639,547
|
|
$
|
2,624,121
|
|
$
|
2,384,249
|
|
|
|
|
|
|
|
|
|
|
|
|
|
|
|
|
|
EBITDA, as adjusted
|
|
|
|
|
|
|
|
|
|
|
|
|
|
|
Same branch
|
|
$
|
91,781
|
|
$
|
82,514
|
|
$
|
334,146
|
|
$
|
283,350
|
|
|
Acquisitions (a)
|
|
|
763
|
|
|
—
|
|
|
24,927
|
|
|
—
|
|
|
Total
|
|
$
|
92,544
|
|
$
|
82,514
|
|
$
|
359,073
|
|
$
|
283,350
|
|
|
|
|
|
|
|
|
|
|
|
|
|
|
|
|
|
EBITDA, as adjusted, as a percentage of sales
|
|
|
|
|
|
|
|
|
|
|
|
|
|
|
Same branch (b)
|
|
|
13.9
|
%
|
|
|
|
|
13.4
|
%
|
|
|
|
|
Acquisitions (c)
|
|
|
29.0
|
%
|
|
|
|
|
19.2
|
%
|
|
|
|
|
Total (d)
|
|
|
14.0
|
%
|
|
12.9
|
%
|
|
13.7
|
%
|
|
11.9
|
%
|
|
|
|
|
|
|
|
|
|
|
|
|
|
|
|
|
As Adjusted Incremental EBITDA, as a percentage of incremental sales
|
|
|
|
|
|
|
|
|
|
|
|
|
|
|
Same branch (e)
|
|
|
45.9
|
%
|
|
|
|
|
46.1
|
%
|
|
|
|
|
Acquisitions (c)
|
|
|
29.0
|
%
|
|
|
|
|
19.2
|
%
|
|
|
|
|
Total (f)
|
|
|
44.0
|
%
|
|
|
|
|
31.6
|
%
|
|
|
|
(a) Represents current year impact of acquisitions in their first twelve months
(b) Same branch EBITDA, as adjusted, as a percentage of same branch sales
(c) Acquired EBITDA, as adjusted, as a percentage of acquired sales
(d) Total EBITDA, as adjusted, as a percentage of total sales
(e) Change in same branch EBITDA, as adjusted, as a percentage of change in same branch sales
(f) Change in total EBITDA, as adjusted, as a percentage of change in total sales
NYSE:BLD February 25, 2020 topbuild.com
TopBuild Corp.
Reconciliation of Adjusted EBITDA to Net Income
(dollars in thousands)
|
|
|
|
|
|
|
|
|
|
|
|
|
|
|
|
|
Three Months Ended December 31,
|
|
Year Ended December 31,
|
|
|
|
2019
|
|
2018
|
|
2019
|
|
2018
|
|
Net income, as reported
|
|
$
|
45,985
|
|
$
|
38,553
|
|
$
|
190,995
|
|
$
|
134,752
|
|
Adjustments to arrive at EBITDA, as adjusted:
|
|
|
|
|
|
|
|
|
|
|
|
|
|
Interest expense and other, net
|
|
|
8,517
|
|
|
9,395
|
|
|
35,745
|
|
|
28,129
|
|
Income tax expense
|
|
|
21,919
|
|
|
17,213
|
|
|
62,783
|
|
|
46,072
|
|
Depreciation and amortization
|
|
|
13,696
|
|
|
12,286
|
|
|
52,700
|
|
|
39,419
|
|
Share-based compensation
|
|
|
2,246
|
|
|
3,072
|
|
|
13,658
|
|
|
11,317
|
|
Rationalization charges
|
|
|
15
|
|
|
929
|
|
|
1,992
|
|
|
7,736
|
|
Acquisition related costs
|
|
|
166
|
|
|
1,066
|
|
|
1,200
|
|
|
15,925
|
|
EBITDA, as adjusted
|
|
$
|
92,544
|
|
$
|
82,514
|
|
$
|
359,073
|
|
$
|
283,350
|
NYSE:BLD February 25, 2020 topbuild.com
TopBuild Corp.
2020 Estimated Adjusted EBITDA Range
(dollars in millions)
|
|
|
|
|
|
|
|
|
Twelve Months Ending December 31, 2020
|
|
|
|
Low
|
|
|
High
|
|
Estimated net income
|
$
|
206.5
|
|
$
|
232.0
|
|
Adjustments to arrive at estimated EBITDA, as adjusted:
|
|
|
|
|
|
|
Interest expense and other, net
|
|
34.0
|
|
|
31.0
|
|
Income tax expense
|
|
72.5
|
|
|
81.5
|
|
Depreciation and amortization
|
|
60.0
|
|
|
56.0
|
|
Share-based compensation
|
|
14.0
|
|
|
11.5
|
|
Estimated EBITDA, as adjusted
|
$
|
387.0
|
|
$
|
412.0
|
NYSE:BLD February 25, 2020 topbuild.com