Exhibit 99.1

NYSE: BLD
A leading installer and distributor of insulation and building material products to the U.S. construction industry
TopBuild Reports First Quarter 2020 Results
|
·
| |
Net sales increased 5.5% |
|
·
| |
Gross margin expanded 120 basis points |
|
·
| |
10.7% operating margin, 10.8% on an adjusted basis, up 130 basis points |
|
·
| |
Adjusted EBITDA increased 18.5%, adjusted EBITDA margin up 150 basis points |
|
·
| |
$1.51 net income per diluted share, $1.37 on an adjusted basis |
First Quarter 2020 Financial Highlights
(unless otherwise indicated, comparisons are to the quarter ended March 31, 2019)
|
✓ Net Sales increased 5.5% to $653.2 million. The increase was primarily driven by increased sales volume and increased selling prices.
|
|
“We are pleased with our strong first quarter results which were only marginally impacted by COVID-19. Top line growth was solid and operating margins expanded in both business segments. We ended the quarter with $576 million of total liquidity and net leverage of 1.46x trailing 12 months adjusted EBITDA. TopBuild has a strong balance sheet with which to manage through the current environment.
“Our cycle-tested leadership team has built a flexible business model focused around achieving operational efficiencies throughout our organization. Given the current environment, we are evaluating every aspect of our business and striking a balance between short term cost reductions and the preservation of the muscle required to fully capitalize on the eventual recovery.
“Be assured, all of our decisions place the health and safety of our employees first.”
Jerry Volas, CEO, TopBuild
|
|
✓ Gross margin increased 120 basis points to 26.3%.
|
|
|
✓ Operating profit was $70.0 million, compared to $56.6 million, a 23.6% increase. On an adjusted basis, operating profit was $70.3 million, compared to $59.1 million, a 18.9% improvement.
|
|
|
✓ Operating margin was 10.7% compared to 9.1%. Adjusted operating margin improved 130 basis points to 10.8%.
|
|
|
✓ Net income was $50.8 million, or $1.51 per diluted share, compared to net income of $38.0 million or $1.09 per diluted share. Adjusted net income was $45.9 million, or $1.37 per diluted share, compared to $36.6 million, or $1.06 per diluted share.
|
|
|
✓ Adjusted EBITDA was $88.4 million, compared to $74.5 million, a 18.5% increase and adjusted EBITDA margin improved 150 basis points to 13.5%. Incremental adjusted EBITDA margin was 40.8%.
|
|
|
✓ At March 31, 2020, the Company had cash and cash equivalents of $187 million and availability under the revolving credit facility of approximately $389 million for total liquidity of $576 million.
|
|
|
NYSE:BLD
|
May 5, 2020
|
topbuild.com
|
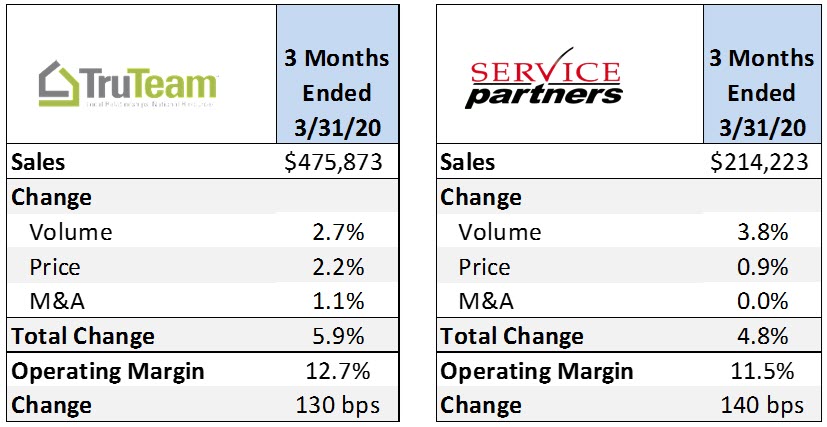
Operating Segment Highlights ($ in 000s)
(comparisons are to the quarter ended March 31, 2019)
Capital Allocation
Acquisitions
The Company completed two acquisitions in the first quarter, Hunter Insulation and Cooper Glass, both of which were previously announced in February. In 2019, the two firms combined generated approximately $19 million in annual revenue.
Share Repurchases
The Company completed the $50 million accelerated share repurchase program announced on October 31, 2019. Under the terms of the program, the Company repurchased a total of 465,956 shares of the Company’s common stock at an average price of $107.31 per share. In addition, in the first quarter the Company repurchased an additional 188,100 shares at an average price of $75.10 per share. These shares were purchased as part of the Company’s $200 million share repurchase program announced on February 26, 2019. As of March 31, 2020, approximately $75 million of the $200 million authorization remained.
Credit Facility Upsized
On March 23, 2020, the Company announced it had entered into a new term loan and revolving credit facility, replacing its previous senior secured facilities. The revolving credit facility was upsized by $200 million to $450 million, which increased total borrowing capacity to $750 million. In addition, the maturity date was extended three years to March 2025.
|
|
|
|
|
NYSE:BLD
|
May 5, 2020
|
topbuild.com
|
|
|
|
|
|
2020 Outlook
On April 14, 2020, the Company withdrew its 2020 Revenue and Adjusted EBITDA guidance due to uncertainty about the full scope of the COVID-19 impact.
Additional Information
Quarterly supplemental materials, including a presentation that will be referenced on today’s conference call, are available on the “Investors” section of the Company’s website at www.topbuild.com.
|
|
“With the national landscape continuing to evolve, it is too early for us to determine the full impact of COVID-19 on our operations. We will continue to proactively respond to changes in the economic environment. We intend to resume guidance when visibility improves.”
Jerry Volas, CEO, TopBuild
|
Conference Call
A conference call to discuss first quarter 2020 financial results is scheduled for today, Tuesday, May 5, 2020, at 9:00 a.m. Eastern Time. The call may be accessed by dialing (888) 225-2706. The conference call will be webcast simultaneously on the “Investors” section of the Company’s website at www.topbuild.com.
About TopBuild
TopBuild Corp., a Fortune 1000 Company headquartered in Daytona Beach, Florida, is a leading installer and distributor of insulation and building material products to the U.S. construction industry. We provide insulation and building material services nationwide through TruTeam®, which has approximately 200 branches, and through Service Partners® which distributes insulation and building material products from approximately 75 branches. We leverage our national footprint to gain economies of scale while capitalizing on our local market presence to forge strong relationships with our customers. To learn more about TopBuild please visit our website at www.topbuild.com.
Use of Non-GAAP Financial Measures
Adjusted EBITDA, incremental EBITDA margin, adjusted EBITDA margin, the “adjusted” financial measures presented above, and figures presented on a “same branch basis” are not calculated in accordance with U.S. generally accepted accounting principles (“GAAP”). The Company believes that these non-GAAP financial measures, which are used in managing the business, may provide users of this financial information with additional meaningful comparisons between current results and results in prior periods. We define same branch sales as sales from branches in operation for at least 12 full calendar months. Such non-GAAP financial measures are reconciled to their closest GAAP financial measures in tables contained in this press release. Non-GAAP financial measures should be viewed in addition to, and not as an alternative for, the Company’s reported results under GAAP. Additional information may be found in the Company’s filings with the Securities and Exchange Commission which are available on TopBuild’s website under “Investors” at www.topbuild.com.
|
|
|
|
|
NYSE:BLD
|
May 5, 2020
|
topbuild.com
|
Safe Harbor Statement
Statements contained in this report that reflect our views about future periods, including our future plans and performance, constitute “forward-looking statements” under the Private Securities Litigation Reform Act of 1995. Forward-looking statements can be identified by words such as “will,” “would,” “anticipate,” “expect,” “believe,” “designed,” “plan,” or “intend,” the negative of these terms, and similar references to future periods. These views involve risks and uncertainties that are difficult to predict and, accordingly, our actual results may differ materially from the results discussed in our forward-looking statements. We caution you against unduly relying on any of these forward-looking statements. Our future performance may be affected by the duration and impact of the COVID-19 pandemic on the United States economy, specifically with respect to residential and commercial construction; our ability to continue operations in markets affected by the COVID-19 pandemic and our ability to collect receivables from our customers; our reliance on residential new construction, residential repair/remodel, and commercial construction; our reliance on third-party suppliers and manufacturers; our ability to attract, develop, and retain talented personnel and our sales and labor force; our ability to maintain consistent practices across our locations; and our ability to maintain our competitive position. We discuss the material risks we face under the caption entitled “Risk Factors” in our Annual Report for the year ended December 31, 2019, as filed with the SEC on February 25, 2020, as well as under the caption entitled “Risk Factors” in subsequent reports that we file with the SEC. Our forward-looking statements in this filing speak only as of the date of this filing. Factors or events that could cause our actual results to differ may emerge from time to time and it is not possible for us to predict all of them. Unless required by law, we undertake no obligation to update publicly any forward-looking statements as a result of new information, future events, or otherwise. The Company believes that the non-GAAP performance measures and ratios that are contained herein, which management uses to manage our business, provide users of this financial information with additional meaningful comparisons between current results and results in our prior periods. Non-GAAP performance measures and ratios should be viewed in addition, and not as an alternative, to the Company's reported results under accounting principles generally accepted in the United States. Additional information about the Company is contained in the Company's filings with the SEC and is available on TopBuild's website at www.topbuild.com.
Investor Relations and Media Contact
Tabitha Zane
tabitha.zane@topbuild.com
386-763-8801
(tables follow)
|
|
|
|
|
NYSE:BLD
|
May 5, 2020
|
topbuild.com
|
TopBuild Corp.
Condensed Consolidated Statements of Operations (Unaudited)
(in thousands, except share and per common share amounts)
|
|
|
|
|
|
|
|
|
|
|
Three Months Ended March 31,
|
|
|
|
2020
|
|
2019
|
|
Net sales
|
|
$
|
653,228
|
|
$
|
619,330
|
|
Cost of sales
|
|
|
481,272
|
|
|
463,635
|
|
Gross profit
|
|
|
171,956
|
|
|
155,695
|
|
|
|
|
|
|
|
|
|
Selling, general, and administrative expense
|
|
|
101,967
|
|
|
99,077
|
|
Operating profit
|
|
|
69,989
|
|
|
56,618
|
|
|
|
|
|
|
|
|
|
Other income (expense), net:
|
|
|
|
|
|
|
|
Interest expense
|
|
|
(8,742)
|
|
|
(9,602)
|
|
Loss on extinguishment of debt
|
|
|
(233)
|
|
|
—
|
|
Other, net
|
|
|
472
|
|
|
333
|
|
Other expense, net
|
|
|
(8,503)
|
|
|
(9,269)
|
|
Income before income taxes
|
|
|
61,486
|
|
|
47,349
|
|
|
|
|
|
|
|
|
|
Income tax expense
|
|
|
(10,715)
|
|
|
(9,366)
|
|
Net income
|
|
$
|
50,771
|
|
$
|
37,983
|
|
|
|
|
|
|
|
|
|
Net income per common share:
|
|
|
|
|
|
|
|
Basic
|
|
$
|
1.53
|
|
$
|
1.11
|
|
Diluted
|
|
$
|
1.51
|
|
$
|
1.09
|
|
|
|
|
|
|
|
|
|
Weighted average shares outstanding:
|
|
|
|
|
|
|
|
Basic
|
|
|
33,168,453
|
|
|
34,169,315
|
|
Diluted
|
|
|
33,599,847
|
|
|
34,703,289
|
|
|
|
|
|
NYSE:BLD
|
May 5, 2020
|
topbuild.com
|
TopBuild Corp.
Condensed Consolidated Balance Sheets and Other Financial Data (Unaudited)
(dollars in thousands)
|
|
|
|
|
|
|
|
|
|
|
As of
|
|
|
|
March 31,
|
|
December 31,
|
|
|
|
2020
|
|
2019
|
|
ASSETS
|
|
|
|
|
|
|
|
Current assets:
|
|
|
|
|
|
|
|
Cash and cash equivalents
|
|
$
|
187,039
|
|
$
|
184,807
|
|
Receivables, net of an allowance for credit losses of $7,200 at March 31, 2020, and allowance for doubtful accounts of $4,854 at December 31, 2019
|
|
|
431,649
|
|
|
428,844
|
|
Inventories, net
|
|
|
152,721
|
|
|
149,078
|
|
Prepaid expenses and other current assets
|
|
|
10,918
|
|
|
17,098
|
|
Total current assets
|
|
|
782,327
|
|
|
779,827
|
|
|
|
|
|
|
|
|
|
Right of use assets
|
|
|
86,080
|
|
|
87,134
|
|
Property and equipment, net
|
|
|
185,575
|
|
|
178,080
|
|
Goodwill
|
|
|
1,379,831
|
|
|
1,367,918
|
|
Other intangible assets, net
|
|
|
182,229
|
|
|
181,122
|
|
Deferred tax assets, net
|
|
|
4,359
|
|
|
4,259
|
|
Other assets
|
|
|
11,439
|
|
|
5,623
|
|
Total assets
|
|
$
|
2,631,840
|
|
$
|
2,603,963
|
|
|
|
|
|
|
|
|
|
LIABILITIES
|
|
|
|
|
|
|
|
Current liabilities:
|
|
|
|
|
|
|
|
Accounts payable
|
|
$
|
305,614
|
|
$
|
307,970
|
|
Current portion of long-term debt
|
|
|
23,091
|
|
|
34,272
|
|
Accrued liabilities
|
|
|
107,327
|
|
|
98,418
|
|
Short-term lease liabilities
|
|
|
35,051
|
|
|
36,094
|
|
Total current liabilities
|
|
|
471,083
|
|
|
476,754
|
|
|
|
|
|
|
|
|
|
Long-term debt
|
|
|
699,750
|
|
|
697,955
|
|
Deferred tax liabilities, net
|
|
|
174,230
|
|
|
175,263
|
|
Long-term portion of insurance reserves
|
|
|
50,928
|
|
|
45,605
|
|
Long-term lease liabilities
|
|
|
54,025
|
|
|
54,010
|
|
Other liabilities
|
|
|
2,007
|
|
|
1,487
|
|
Total liabilities
|
|
|
1,452,023
|
|
|
1,451,074
|
|
|
|
|
|
|
|
|
|
EQUITY
|
|
|
1,179,817
|
|
|
1,152,889
|
|
Total liabilities and equity
|
|
$
|
2,631,840
|
|
$
|
2,603,963
|
|
|
|
|
|
|
|
|
|
|
|
|
As of March 31,
|
|
|
|
|
2020
|
|
2019
|
|
|
Other Financial Data
|
|
|
|
|
|
|
|
|
Receivable days
|
|
|
51
|
|
|
53
|
|
|
Inventory days
|
|
|
29
|
|
|
31
|
|
|
Accounts payable days
|
|
|
79
|
|
|
80
|
|
|
Receivables, net plus inventories, net less accounts payable
|
|
$
|
278,756
|
|
$
|
308,056
|
|
|
Receivables, net plus inventories, net less accounts payable as a percent of sales (TTM)‡
|
|
|
10.5
|
%
|
|
12.1
|
%
|
|
|
|
‡ Trailing 12 months sales have been adjusted for the pro forma effect of acquired branches.
|
|
|
|
|
|
NYSE:BLD
|
May 5, 2020
|
topbuild.com
|
TopBuild Corp.
Condensed Consolidated Statements of Cash Flows (Unaudited)
(dollars in thousands)
|
|
|
|
|
|
|
|
|
|
|
Three Months Ended March 31,
|
|
|
|
2020
|
|
2019
|
|
Cash Flows Provided by (Used in) Operating Activities:
|
|
|
|
|
|
|
|
Net income
|
|
$
|
50,771
|
|
$
|
37,983
|
|
Adjustments to reconcile net income to net cash provided by operating activities:
|
|
|
|
|
|
|
|
Depreciation and amortization
|
|
|
14,190
|
|
|
12,475
|
|
Share-based compensation
|
|
|
3,908
|
|
|
2,972
|
|
Loss on extinguishment of debt
|
|
|
233
|
|
|
—
|
|
Loss on sale or abandonment of property and equipment
|
|
|
383
|
|
|
487
|
|
Amortization of debt issuance costs
|
|
|
328
|
|
|
390
|
|
Provision for bad debt expense
|
|
|
1,670
|
|
|
1,676
|
|
Loss from inventory obsolescence
|
|
|
529
|
|
|
1,109
|
|
Deferred income taxes, net
|
|
|
(39)
|
|
|
95
|
|
Change in certain assets and liabilities
|
|
|
|
|
|
|
|
Receivables, net
|
|
|
(5,048)
|
|
|
(23,341)
|
|
Inventories, net
|
|
|
(3,964)
|
|
|
7,125
|
|
Prepaid expenses and other current assets
|
|
|
6,193
|
|
|
11,192
|
|
Accounts payable
|
|
|
(4,173)
|
|
|
(31,407)
|
|
Accrued liabilities
|
|
|
9,981
|
|
|
2,100
|
|
Other, net
|
|
|
(2,032)
|
|
|
666
|
|
Net cash provided by operating activities
|
|
|
72,930
|
|
|
23,522
|
|
|
|
|
|
|
|
|
|
Cash Flows Provided by (Used in) Investing Activities:
|
|
|
|
|
|
|
|
Purchases of property and equipment
|
|
|
(15,892)
|
|
|
(10,213)
|
|
Acquisition of businesses
|
|
|
(20,526)
|
|
|
—
|
|
Proceeds from sale of property and equipment
|
|
|
194
|
|
|
75
|
|
Other, net
|
|
|
—
|
|
|
16
|
|
Net cash used in investing activities
|
|
|
(36,224)
|
|
|
(10,122)
|
|
|
|
|
|
|
|
|
|
Cash Flows Provided by (Used in) Financing Activities:
|
|
|
|
|
|
|
|
Proceeds from issuance of long-term debt
|
|
|
300,000
|
|
|
—
|
|
Repayment of long-term debt
|
|
|
(307,668)
|
|
|
(5,601)
|
|
Payment of debt issuance costs
|
|
|
(2,280)
|
|
|
—
|
|
Taxes withheld and paid on employees' equity awards
|
|
|
(10,399)
|
|
|
(5,578)
|
|
Repurchase of shares of common stock
|
|
|
(14,127)
|
|
|
(4,622)
|
|
Payment of contingent consideration
|
|
|
—
|
|
|
(250)
|
|
Net cash used in financing activities
|
|
|
(34,474)
|
|
|
(16,051)
|
|
|
|
|
|
|
|
|
|
Cash and Cash Equivalents
|
|
|
|
|
|
|
|
Increase (decrease) for the period
|
|
|
2,232
|
|
|
(2,651)
|
|
Beginning of period
|
|
|
184,807
|
|
|
100,929
|
|
End of period
|
|
$
|
187,039
|
|
$
|
98,278
|
|
|
|
|
|
|
|
|
|
Supplemental disclosure of noncash activities:
|
|
|
|
|
|
|
|
Leased assets obtained in exchange for new operating lease liabilities
|
|
$
|
9,167
|
|
$
|
105,249
|
|
Accruals for property and equipment
|
|
|
496
|
|
|
441
|
|
|
|
|
|
|
|
|
|
|
|
|
|
NYSE:BLD
|
May 5, 2020
|
topbuild.com
|
TopBuild Corp.
Segment Data (Unaudited)
(dollars in thousands)
|
|
|
|
|
|
|
|
|
|
|
|
|
|
|
Three Months Ended March 31,
|
|
|
|
|
|
|
|
2020
|
|
2019
|
|
Change
|
|
|
TruTeam
|
|
|
|
|
|
|
|
|
|
|
|
Sales
|
|
$
|
475,873
|
|
$
|
449,383
|
|
|
5.9
|
%
|
|
|
|
|
|
|
|
|
|
|
|
|
|
Operating profit, as reported
|
|
$
|
60,351
|
|
$
|
51,299
|
|
|
|
|
|
Operating margin, as reported
|
|
|
12.7
|
%
|
|
11.4
|
%
|
|
|
|
|
|
|
|
|
|
|
|
|
|
|
|
|
Rationalization charges
|
|
|
—
|
|
|
118
|
|
|
|
|
|
Acquisition related costs
|
|
|
4
|
|
|
125
|
|
|
|
|
|
Operating profit, as adjusted
|
|
$
|
60,355
|
|
$
|
51,542
|
|
|
|
|
|
Operating margin, as adjusted
|
|
|
12.7
|
%
|
|
11.5
|
%
|
|
|
|
|
|
|
|
|
|
|
|
|
|
|
|
|
Service Partners
|
|
|
|
|
|
|
|
|
|
|
|
Sales
|
|
$
|
214,223
|
|
$
|
204,464
|
|
|
4.8
|
%
|
|
|
|
|
|
|
|
|
|
|
|
|
|
Operating profit, as reported
|
|
$
|
24,669
|
|
$
|
20,597
|
|
|
|
|
|
Operating margin, as reported
|
|
|
11.5
|
%
|
|
10.1
|
%
|
|
|
|
|
|
|
|
|
|
|
|
|
|
|
|
|
Rationalization charges
|
|
|
—
|
|
|
109
|
|
|
|
|
|
Operating profit, as adjusted
|
|
$
|
24,669
|
|
$
|
20,706
|
|
|
|
|
|
Operating margin, as adjusted
|
|
|
11.5
|
%
|
|
10.1
|
%
|
|
|
|
|
|
|
|
|
|
|
|
|
|
|
|
|
Total
|
|
|
|
|
|
|
|
|
|
|
|
Sales before eliminations
|
|
$
|
690,096
|
|
$
|
653,847
|
|
|
|
|
|
Intercompany eliminations
|
|
|
(36,868)
|
|
|
(34,517)
|
|
|
|
|
|
Net sales after eliminations
|
|
$
|
653,228
|
|
$
|
619,330
|
|
|
5.5
|
%
|
|
|
|
|
|
|
|
|
|
|
|
|
|
Operating profit, as reported - segments
|
|
$
|
85,020
|
|
$
|
71,896
|
|
|
|
|
|
General corporate expense, net
|
|
|
(9,198)
|
|
|
(9,604)
|
|
|
|
|
|
Intercompany eliminations
|
|
|
(5,833)
|
|
|
(5,674)
|
|
|
|
|
|
Operating profit, as reported
|
|
$
|
69,989
|
|
$
|
56,618
|
|
|
|
|
|
Operating margin, as reported
|
|
|
10.7
|
%
|
|
9.1
|
%
|
|
|
|
|
|
|
|
|
|
|
|
|
|
|
|
|
Rationalization charges †
|
|
|
—
|
|
|
1,827
|
|
|
|
|
|
Acquisition related costs
|
|
|
235
|
|
|
652
|
|
|
|
|
|
Refinancing costs
|
|
|
37
|
|
|
—
|
|
|
|
|
|
Operating profit, as adjusted
|
|
$
|
70,261
|
|
$
|
59,097
|
|
|
|
|
|
Operating margin, as adjusted
|
|
|
10.8
|
%
|
|
9.5
|
%
|
|
|
|
|
|
|
|
|
|
|
|
|
|
|
|
|
Share-based compensation
|
|
|
3,908
|
|
|
2,972
|
|
|
|
|
|
Depreciation and amortization
|
|
|
14,190
|
|
|
12,475
|
|
|
|
|
|
EBITDA, as adjusted
|
|
$
|
88,359
|
|
$
|
74,544
|
|
|
|
|
|
EBITDA margin, as adjusted
|
|
|
13.5
|
%
|
|
12.0
|
%
|
|
|
|
|
|
|
|
|
|
|
|
|
|
|
|
|
Sales change period over period
|
|
|
33,898
|
|
|
|
|
|
|
|
|
EBITDA, as adjusted, change period over period
|
|
|
13,815
|
|
|
|
|
|
|
|
|
EBITDA, as adjusted, as percentage of sales change
|
|
|
40.8
|
%
|
|
|
|
|
|
|
† Rationalization charges include corporate level adjustments as well as segment operating adjustments.
|
|
|
|
|
NYSE:BLD
|
May 5, 2020
|
topbuild.com
|
TopBuild Corp.
Non-GAAP Reconciliations (Unaudited)
(in thousands, except share and per common share amounts)
|
|
|
|
|
|
|
|
|
|
|
|
Three Months Ended March 31,
|
|
|
|
|
2020
|
|
2019
|
|
|
Gross Profit and Operating Profit Reconciliations
|
|
|
|
|
|
|
|
|
|
|
|
|
|
|
|
|
|
Net sales
|
|
$
|
653,228
|
|
$
|
619,330
|
|
|
|
|
|
|
|
|
|
|
|
Gross profit, as reported
|
|
$
|
171,956
|
|
$
|
155,695
|
|
|
|
|
|
|
|
|
|
|
|
Rationalization charges
|
|
|
—
|
|
|
—
|
|
|
Gross profit, as adjusted
|
|
$
|
171,956
|
|
$
|
155,695
|
|
|
|
|
|
|
|
|
|
|
|
Gross margin, as reported
|
|
|
26.3
|
%
|
|
25.1
|
%
|
|
Gross margin, as adjusted
|
|
|
26.3
|
%
|
|
25.1
|
%
|
|
|
|
|
|
|
|
|
|
|
Operating profit, as reported
|
|
$
|
69,989
|
|
$
|
56,618
|
|
|
|
|
|
|
|
|
|
|
|
Rationalization charges
|
|
|
—
|
|
|
1,827
|
|
|
Acquisition related costs
|
|
|
235
|
|
|
652
|
|
|
Refinancing costs
|
|
|
37
|
|
|
—
|
|
|
Operating profit, as adjusted
|
|
$
|
70,261
|
|
$
|
59,097
|
|
|
|
|
|
|
|
|
|
|
|
Operating margin, as reported
|
|
|
10.7
|
%
|
|
9.1
|
%
|
|
Operating margin, as adjusted
|
|
|
10.8
|
%
|
|
9.5
|
%
|
|
|
|
|
|
|
|
|
|
|
Income Per Common Share Reconciliation
|
|
|
|
|
|
|
|
|
|
|
|
|
|
|
|
|
|
Income before income taxes, as reported
|
|
$
|
61,486
|
|
$
|
47,349
|
|
|
|
|
|
|
|
|
|
|
|
Rationalization charges
|
|
|
—
|
|
|
1,827
|
|
|
Acquisition related costs
|
|
|
235
|
|
|
652
|
|
|
Refinancing costs and loss on extinguishment of debt
|
|
|
270
|
|
|
—
|
|
|
Income before income taxes, as adjusted
|
|
|
61,991
|
|
|
49,828
|
|
|
|
|
|
|
|
|
|
|
|
Tax rate at 26.0% and 26.5% for 2020 and 2019, respectively
|
|
|
(16,118)
|
|
|
(13,204)
|
|
|
Income, as adjusted
|
|
$
|
45,873
|
|
$
|
36,624
|
|
|
|
|
|
|
|
|
|
|
|
Income per common share, as adjusted
|
|
$
|
1.37
|
|
$
|
1.06
|
|
|
|
|
|
|
|
|
|
|
|
Weighted average diluted common shares outstanding
|
|
|
33,599,847
|
|
|
34,703,289
|
|
|
|
|
|
|
NYSE:BLD
|
May 5, 2020
|
topbuild.com
|
TopBuild Corp.
Same Branch and Acquisition Net Sales and Adjusted EBITDA (Unaudited)
(dollars in thousands)
|
|
|
|
|
|
|
|
|
|
|
|
Three Months Ended March 31,
|
|
|
|
|
2020
|
|
2019
|
|
|
Net sales
|
|
|
|
|
|
|
|
|
Same branch:
|
|
|
|
|
|
|
|
|
Installation segment
|
|
$
|
471,008
|
|
$
|
449,383
|
|
|
Distribution segment
|
|
|
214,223
|
|
|
204,464
|
|
|
Eliminations
|
|
|
(36,868)
|
|
|
(34,517)
|
|
|
Total same branch
|
|
|
648,363
|
|
|
619,330
|
|
|
|
|
|
|
|
|
|
|
|
Acquisitions (a):
|
|
|
|
|
|
|
|
|
Installation segment
|
|
$
|
4,865
|
|
$
|
—
|
|
|
Distribution segment
|
|
|
—
|
|
|
—
|
|
|
Eliminations
|
|
|
—
|
|
|
—
|
|
|
Total acquisitions
|
|
|
4,865
|
|
|
—
|
|
|
Total
|
|
$
|
653,228
|
|
$
|
619,330
|
|
|
|
|
|
|
|
|
|
|
|
EBITDA, as adjusted
|
|
|
|
|
|
|
|
|
Same branch
|
|
$
|
87,266
|
|
$
|
74,544
|
|
|
Acquisitions (a)
|
|
|
1,093
|
|
|
—
|
|
|
Total
|
|
$
|
88,359
|
|
$
|
74,544
|
|
|
|
|
|
|
|
|
|
|
|
EBITDA, as adjusted, as a percentage of sales
|
|
|
|
|
|
|
|
|
Same branch (b)
|
|
|
13.5
|
%
|
|
|
|
|
Acquisitions (c)
|
|
|
22.5
|
%
|
|
|
|
|
Total (d)
|
|
|
13.5
|
%
|
|
12.0
|
%
|
|
|
|
|
|
|
|
|
|
|
As Adjusted Incremental EBITDA, as a percentage of incremental sales
|
|
|
|
|
|
|
|
|
Same branch (e)
|
|
|
43.8
|
%
|
|
|
|
|
Acquisitions (c)
|
|
|
22.5
|
%
|
|
|
|
|
Total (f)
|
|
|
40.8
|
%
|
|
|
|
(a) Represents current year impact of acquisitions in their first twelve months
(b) Same branch EBITDA, as adjusted, as a percentage of same branch sales
(c) Acquired EBITDA, as adjusted, as a percentage of acquired sales
(d) Total EBITDA, as adjusted, as a percentage of total sales
(e) Change in same branch EBITDA, as adjusted, as a percentage of change in same branch sales
(f) Change in total EBITDA, as adjusted, as a percentage of change in total sales
|
|
|
|
|
NYSE:BLD
|
May 5, 2020
|
topbuild.com
|
TopBuild Corp.
Reconciliation of Adjusted EBITDA to Net Income (Unaudited)
(in thousands)
|
|
|
|
|
|
|
|
|
|
|
Three Months Ended March 31,
|
|
|
|
2020
|
|
2019
|
|
Net income, as reported
|
|
$
|
50,771
|
|
$
|
37,983
|
|
Adjustments to arrive at EBITDA, as adjusted:
|
|
|
|
|
|
|
|
Interest expense and other, net
|
|
|
8,270
|
|
|
9,269
|
|
Income tax expense
|
|
|
10,715
|
|
|
9,366
|
|
Depreciation and amortization
|
|
|
14,190
|
|
|
12,475
|
|
Share-based compensation
|
|
|
3,908
|
|
|
2,972
|
|
Rationalization charges
|
|
|
—
|
|
|
1,827
|
|
Acquisition related costs
|
|
|
235
|
|
|
652
|
|
Refinancing costs and loss on extinguishment of debt
|
|
|
270
|
|
|
—
|
|
EBITDA, as adjusted
|
|
$
|
88,359
|
|
$
|
74,544
|
|
|
|
|
|
NYSE:BLD
|
May 5, 2020
|
topbuild.com
|