UNITED STATES SECURITIES AND EXCHANGE COMMISSION
WASHINGTON, D.C. 20549
FORM 10-K
(Mark One) | |
ANNUAL REPORT PURSUANT TO SECTION 13 OR 15(d) OF THE SECURITIES EXCHANGE ACT OF 1934 | |
For the fiscal year ended
TRANSITION REPORT PURSUANT TO SECTION 13 OR 15(d) OF THE SECURITIES EXCHANGE ACT OF 1934 |
For the transition period from to
Commission file number:
(Exact Name of Registrant as Specified in its Charter)
(State or Other Jurisdiction of Incorporation or | (I.R.S. Employer |
(Address of Principal Executive Offices) | (Zip Code) |
(
(Registrant’s telephone number, including area code)
Securities registered pursuant to Section 12(b) of the Act:
Title of each class | Trading Symbol(s) | Name of each exchange on which registered |
Securities registered pursuant to section 12(g) of the Act:
None
Indicate by check mark if the registrant is a well-known seasoned issuer, as defined in Rule 405 of the Securities Act.
⌧
Indicate by check mark if the registrant is not required to file reports pursuant to Section 13 or Section 15(d) of the Act.
◻ Yes ⌧
Indicate by check mark whether the registrant (1) has filed all reports required to be filed by Section 13 or 15(d) of the Securities Exchange Act of 1934 during the preceding 12 months (or for such shorter period that the registrant was required to file such reports), and (2) has been subject to such filing requirements for the past 90 days.
⌧
Indicate by check mark whether the registrant has submitted electronically every Interactive Data File required to be submitted pursuant to Rule 405 of Regulation S-T (§232.405 of this chapter) during the preceding 12 months (or for such shorter period that the registrant was required to submit such files).
⌧
Indicate by check mark whether the registrant is a large accelerated filer, an accelerated filer, a non-accelerated filer, a smaller reporting company, or emerging growth company. See the definitions of “large accelerated filer,” “accelerated filer,” “smaller reporting company,” and “emerging growth company” in Rule 12b-2 of the Exchange Act.
If an emerging growth company, indicate by check mark if the registrant has elected not to use the extended transition period for complying with any new or revised financial accounting standards provided pursuant to Section 13(a) of the Exchange Act. ◻
Indicate by check mark whether the registrant has filed a report on and attestation to its management’s assessment of the effectiveness of its internal control over financial reporting under Section 404(b) of the Sarbanes-Oxley Act (15 U.S.C. 7262(b)) by the registered public accounting firm that prepared or issued its audit report.
Indicate by check mark whether the registrant is a shell company (as defined in Rule 12b-2 of the Exchange Act).
The aggregate market value of the registrant’s common stock held by non-affiliates of the registrant based on the closing price of $197.78 per share as reported on the New York Stock Exchange on June 30, 2021, the last business day of the registrant’s most recently completed second fiscal quarter, was approximately $
Number of shares of common stock outstanding as of February 14, 2022:
DOCUMENTS INCORPORATED BY REFERENCE
Portions of the Registrant’s Proxy Statement for its 2021 Annual Meeting of Shareholders, to be filed with the Securities and Exchange Commission no later than 120 days after December 31, 2021, are incorporated by reference into Part III of this Form 10-K.
TOPBUILD CORP.
TABLE OF CONTENTS
2
GLOSSARY
We use acronyms, abbreviations, and other defined terms throughout this Annual Report on Form 10-K, as defined in the glossary below:
Term | Definition | |
3.625% Senior Notes | TopBuild's 3.625% senior unsecured notes issued March 15, 2021 and due March 15, 2029 | |
4.125% Senior Notes | TopBuild's 4.125% senior unsecured notes issued October 14, 2021 and due February 15, 2032 | |
5.625% Senior Notes | TopBuild's 5.625% senior unsecured notes which were due on May 1, 2026 and redeemed in full on March 15, 2021 | |
2015 LTIP | 2015 Long-Term Incentive Program authorizes the Board to grant stock options, stock appreciation rights, restricted shares, restricted share units, performance awards, and dividend equivalents | |
2019 ASR Agreement | $50 million accelerated share repurchase agreement with Bank of America, N.A. | |
2019 Repurchase Program | $200 million share repurchase program authorized by the Board on February 22, 2019 | |
2021 Repurchase Program | $200 million share repurchase program authorized by the Board on July 26, 2021 | |
ABS | American Building Systems, Inc. | |
Amendment No. 1 to Credit Agreement | Amendment No. 1 to the Credit Agreement dated March 8, 2021 | |
Amendment No. 2 to Credit Agreement | Amendment No. 2 to the Credit Agreement dated October 7, 2021 | |
Annual Report | Annual report filed with the SEC on Form 10-K pursuant to Section 13 or 15(d) of the Securities Exchange Act of 1934 | |
ASC | Accounting Standards Codification | |
ASU | Accounting Standards Update | |
Board | Board of Directors of TopBuild | |
BofA | Bank of America, N.A. | |
Cooper | Cooper Glass Company, LLC | |
Current Report | Current report filed with the SEC on Form 8-K pursuant to Section 13 or 15(d) of the Securities Exchange Act of 1934 | |
DI | DI Super Holdings, Inc. | |
EBITDA | Earnings before interest, taxes, depreciation, and amortization | |
Exchange Act | The Securities Exchange Act of 1934, as amended | |
FASB | Financial Accounting Standards Board | |
GAAP | Generally accepted accounting principles in the United States of America | |
Garland | Garland Insulating, Ltd. | |
Hunter | J.P. Hunter Enterprises, Inc. | |
IBR | Incremental borrowing rate, as defined in ASC 842 | |
Lenders | Bank of America, N.A., together with the other lenders party to "Credit Agreement" | |
LCR | L.C.R. Contractors, LLC | |
LIBOR | London interbank offered rate | |
Masco | Masco Corporation | |
Net Leverage Ratio | As defined in the “Credit Agreement,” the ratio of outstanding indebtedness, less up to $100 million of unrestricted cash, to EBITDA | |
NYSE | New York Stock Exchange | |
Credit Agreement | Senior secured credit agreement and related security and pledge agreement dated May 5, 2017, as amended and restated on March 20, 2020, and further amended by Amendment No. 1 to Credit Agreement and Amendment No. 2 to Credit Agreement | |
Quarterly Report | Quarterly report filed with the SEC on Form 10-Q pursuant to Section 13 or 15(d) of the Securities Exchange Act of 1934 | |
ROU | Right of use (asset), as defined in ASC 842 | |
RSA | Restricted stock award | |
SEC | United States Securities and Exchange Commission | |
Secured Leverage Ratio | As defined in the “Credit Agreement,” the ratio of outstanding indebtedness, including letters of credit, to EBITDA | |
Separation | Distribution of 100 percent of the outstanding capital stock of TopBuild to holders of Masco common stock | |
TopBuild | TopBuild Corp. and its wholly-owned consolidated domestic subsidiaries. Also, the "Company," | |
Valley | Valley Gutter Supply, Inc. | |
Viking | Viking Insulation Co. |
3
SPECIAL NOTE REGARDING FORWARD-LOOKING STATEMENTS
Statements contained in this Annual Report that reflect our views about future periods, including our future plans and performance, constitute “forward-looking statements” under the Private Securities Litigation Reform Act of 1995. Forward-looking statements can be identified by words such as “will,” “would,” “anticipate,” “expect,” “believe,” “designed,” “plan,” or “intend,” the negative of these terms, and similar references to future periods. These views involve risks and uncertainties that are difficult to predict and, accordingly, our actual results may differ materially from the results discussed in our forward-looking statements. We caution you against unduly relying on any of these forward-looking statements. Our future performance may be affected by the duration and impact of the COVID-19 pandemic on the United States economy, specifically with respect to residential and commercial construction, our ability to continue operations in markets affected by the COVID-19 pandemic, and our ability to collect our receivables from our customers, our reliance on residential new construction, residential repair/remodel, and commercial construction; our reliance on third-party suppliers and manufacturers; our ability to attract, develop, and retain talented personnel and our sales and labor force; our ability to maintain consistent practices across our locations; our ability to maintain our competitive position; and our ability to realize the expected benefits of our acquisitions. We discuss the material risks we face under the caption entitled “Risk Factors” in Item 1A of this Annual Report. Our forward-looking statements in this Annual Report speak only as of the date of this Annual Report. Factors or events that could cause our actual results to differ may emerge from time to time and it is not possible for us to predict all of them. Unless required by law, we undertake no obligation to update publicly any forward-looking statements as a result of new information, future events, or otherwise.
PART I
Item 1. BUSINESS
Overview
TopBuild Corp., headquartered in Daytona Beach, Florida, is a leading installer and specialty distributor of insulation and other building material products to the construction industry in the United States and Canada. On July 1, 2015, we began trading on the NYSE under the symbol “BLD.”
Segment Overview
We operate in two segments: our Installation segment, which accounts for 68% of our sales, and our Specialty Distribution segment, which accounts for 32% of our sales.
We believe that having both Installation and Specialty Distribution provides us with a number of distinct competitive advantages. First, the combined buying power of our two business segments, along with our scale, strengthens our ties to the major manufacturers of insulation and other building material products. This helps to ensure we are buying competitively and ensures the availability of supply to our local branches and distribution centers. The overall effect is driving efficiencies through our supply chain. Second, being a leader in both installation and specialty distribution allows us to reach a broader set of builders and contractors more effectively, regardless of their size or geographic location in the U.S. and Canada, and leverage housing and commercial construction growth wherever it occurs. Third, during housing industry downturns, many insulation contractors who buy directly from manufacturers during industry peaks return to purchasing through specialty distributors. As a result, this helps to reduce our exposure to cyclical swings in our business.
Installation
We provide insulation installation services nationwide through our contractor services business which has approximately 235 branches located across the United States.
Various insulation applications we install include:
| ● | Fiberglass batts and rolls |
| ● | Blown-in loose fill fiberglass |
| ● | Polyurethane spray foam |
| ● | Blown-in loose fill cellulose |
4
In addition to insulation products, which represented 79% of our Installation segment’s sales during the year ended December 31, 2021, we install other building products including glass and windows, rain gutters, afterpaint products, fireproofing, garage doors, and fireplaces.
We handle every stage of the installation process including material procurement supplied by leading manufacturers, project scheduling and logistics, multi-phase professional installation, and installation quality assurance. The amount of insulation installed in a new home or commercial building is regulated by various building and energy codes.
Our Installation customer base includes national and regional single-family homebuilders, single-family custom builders, multi-family builders, commercial general contractors, remodelers, and individual homeowners.
Through our TopBuild Home Services, Inc. subsidiary (“Home Services”) and our Environments for Living® program, we offer services and tools designed to assist builders with applying the principles of building science to new home construction. We offer pre-construction plan reviews using industry-standard home-energy analysis software, various inspection services, and diagnostic testing. Home Services is one of the top ten Home Energy Rating System Index (HERS) raters in the U.S.
Specialty Distribution
We distribute building and mechanical insulation, insulation accessories and other building product materials for the residential, commercial, and industrial end markets through our Specialty Distribution business. In addition to insulation and accessories, we distribute rain gutters, fireplaces, closet shelving, and roofing materials, among other items. Insulation and insulation accessories, primarily fiberglass and spray foam, comprise approximately 82% of our Specialty Distribution sales. We have approximately 155 distribution centers across the United States and 18 branches in Canada. Our customer base consists of thousands of insulation contractors of all sizes serving a wide variety of commercial and industrial industries, gutter contractors, weatherization contractors, other contractors, dealers, metal building erectors, and modular home builders.
For further information on our segments, see Item 8. Financial Statements and Supplementary Data – Note 8. Segment Information.
Demand for Our Products and Services
Demand for our insulation products and services is driven by new single-family residential and multi-family home construction, commercial and industrial construction, residential remodel and repair activity, commercial and industrial maintenance and repair, and the growing need for more energy efficient homes, commercial structures, and industrial plants. Being a leader in both insulation installation and specialty distribution allows us to reach a broader set of customers more effectively. We recognize that competition for the installation and sale of insulation and other building material products occurs in localized geographic markets in the U.S. and Canada, and, as such, our operating model is based on geographically diverse branches along with building and maintaining local customer relationships. At the same time, our local operations benefit from centralized functions such as purchasing, information technology, sales and marketing support, and credit and collections.
Activity in the construction industry is seasonal, typically peaking in the summer months. Because installation of insulation historically lags housing starts by several months, we generally see a corresponding benefit in our operating results during the third and fourth quarters.
Competitive Advantages
The market for the distribution and installation of building product materials is highly fragmented and competitive. Barriers to entry for local competitors are relatively low, increasing the risk that additional competitors will emerge. Our ability to maintain our competitive position depends on a number of factors including our scale, sales channels, diversified product lines, operation capabilities, strong local presence, the unique ability to offset decreases in demand for services with our Specialty Distribution business, and strong cash flows.
5
Scale. Within our geographic footprint, we provide products and services to each major construction line of business in the U.S. and provide industrial and commercial products in Canada. Our scale and local market presence combined with our various centralized corporate functions and corporate executive management team, enable us to successfully compete as we:
| ● | Leverage systems, management, and best practice processes across both our Installation and Specialty Distribution businesses; |
| ● | Provide national and regional home builders and commercial general contractors with broad geographic reach, while maintaining consistent policies and practices that enable reliable, high-quality products and services across many geographies and building sites; |
| ● | Provide designers and installers of mechanical systems for commercial and industrial buildings technical knowledge and expertise and value-add fabrication services |
| ● | Leverage our strong ties to major manufacturers of insulation and other building products to help ensure we are buying competitively, maintaining our supply to our local branches and distribution centers, and driving efficiencies throughout our supply chain; |
| ● | Provide consistent, customized support and geographic coverage to our customers; and |
| ● | Maintain an operating capacity that allows us to ramp-up rapidly, without major incremental investment, to target forecasted growth in housing starts and construction activity in each of our lines of business throughout the U.S. and Canada. |
Two avenues to reach builders and contractors. We believe that having both installation and specialty distribution businesses provides a number of advantages to reaching our customers and driving share gains. Our Installation business customer base includes builders of all sizes. Our branches go to market with the local brands that regional and custom builders recognize and value, and our national footprint is appealing to large builders who value consistency across a broad geography. Our Specialty Distribution business focuses on selling to small contractors who generally have strong local relationships with smaller custom builders and general contractors, and to industrial general contractors and facilities requiring customized solutions on a recurring basis. Being a leader in both installation and specialty distribution allows us to more effectively reach a broader set of builder customers and contractors, regardless of their size or geographic location within the U.S. and Canada, and leverage new construction housing, commercial and industrial growth wherever it occurs.
Diversified lines of business. In response to the housing downturn in prior years and to mitigate the cyclicality of residential new home construction, we expanded and enhanced our ability to serve the commercial construction line of business. This included expanding our commercial operations and sales capacity, adding commercial product offerings, developing relationships with commercial general contractors, and building our expertise and reputation for quality service for both light and heavy commercial construction projects. Although commercial construction is affected by many of the same macroeconomic and local economic factors that drive residential new construction, commercial construction has historically followed different cycles than residential new construction.
Strong local presence. Competition for the installation and sale of insulation and other building material products to builders occurs in localized geographic markets throughout the U.S. and Canada. Builders and contractors in each local market have different options in terms of choosing among insulation installers and specialty distributors for their projects, and value local relationships, quality, and timeliness. Our Installation branches are locally branded businesses that are recognized within the communities in which they operate. Our Service Partners distribution centers service primarily local contractors, lumberyards, retail stores and others who, in turn, service local homebuilders and other customers, while our Distribution International distribution centers service primarily industrial customers with customized recurring requirements. Our operating model, in which individual branches and distribution centers maintain local customer relationships, enables us to develop local, long-tenured relationships with these customers, build local reputations for quality, service and timeliness, and provide specialized products and personalized services tailored to a geographic region or customer. At the same time, our local operations benefit from centralized functions, such as purchasing, information technology, sales support, and credit and collections, and the resources and scale efficiencies of an installation and distribution business that has a presence across the U.S. and Canada.
6
Unique ability to offset decreases in demand for services with our Specialty Distribution business. During industry downturns many insulation contractors, who buy directly from manufacturers during industry peaks, return to purchasing through distributors for small, “Less Than Full Truckload” shipments. This drives incremental customers to our Specialty Distribution business during these points in the business cycle, offsetting decreases in demand for installation services in our Installation business because of a downturn. We believe that our leadership position in both installation and specialty distribution helps to reduce exposure to cyclical swings in our lines of business.
Strong cash flow and favorable working capital fund organic growth. Over the last several years, we have reduced fixed costs and improved our labor utilization. As a result, we can achieve profitability at lower levels of demand as compared to historical periods. For further discussion on our cash flows and liquidity, see Item 7. Management’s Discussion and Analysis of Financial Condition and Results of Operations – Liquidity and Capital Resources.
Major Customers
We have a diversified portfolio of customers and no single customer accounted for more than three percent of our total revenues for the year ended December 31, 2021. Our top ten customers accounted for approximately 11 percent of our total sales in 2021.
Suppliers
Our businesses depend on our ability to obtain an adequate supply of high-quality products and components from manufacturers and other suppliers, upon whom we rely heavily. We source the majority of our fiberglass building products from four primary U.S.-based residential fiberglass insulation manufacturers: Knauf, CertainTeed, Johns Manville, and Owens Corning. Failure by our suppliers to provide us with an adequate supply of high-quality products on commercially reasonable terms, or to comply with applicable legal requirements, could have a material, adverse effect on our financial condition or operating results. We believe we generally have positive relationships with our suppliers.
Human Capital
As a leading installer of insulation and specialty distributor of insulation and building material products to the construction industry in the U.S. and Canada, our performance relies heavily on human capital and relationships with customers and suppliers. Accordingly, our success depends on our ability to attract, retain, protect, and develop our employees. To support these objectives, we have designed and implemented a human capital management program that fosters a culture of inclusivity, collaboration, support, and innovation where every voice is welcome, heard, and respected.
Safety
The success of our business is fundamentally connected to safety. A primary responsibility of our employees is to provide a safe environment for their co-workers, our customers, and our suppliers. Safety is one of our core values and is engrained in our culture and is an important measure in how we rate our success as a company. To align our leadership team with our safety goals, a portion of our leadership’s incentive compensation is tied to our safety performance.
Our goal is to have zero incidents, which we strive to achieve by providing our employees with ongoing, specialized safety training sessions, information, and programs. This training commences at hiring, with additional sessions delivered at every branch operation and at our Branch Support Center in Daytona Beach, Florida throughout the year. During 2021, we assigned each of our field employees an average of 15.6 hours of safety training.
7
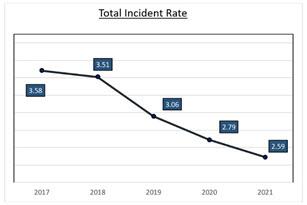
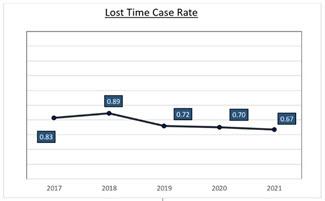
We closely monitor OSHA reportable injuries and conduct extensive research to better understand and improve our work environments. We disclose our incident rates and lost time case rate in the ESG section of our website and have seen continuous improvement in our safety performance year-over-year as indicated in the tables below. In 2021, our incident rate improved by over 7% to 2.59 per the OSHA guidelines, and our lost time case rate remains below industry averages and continues to improve.
|
| |
Our incident rate does not include acquisitions or potential work-related COVID-19 exposures, for which we have implemented additional safety measures at all our branches and on worksites, including increasing the frequency of regular cleaning and disinfecting processes at our facilities, adhering to social distancing protocols, limiting the number of workers on our jobsites, providing paid time for vaccinations, and offering remote/hybrid work schedules for employees in our support centers in Daytona Beach, Florida, Houston, Texas and Greenville, South Carolina.
Employee Demographics and Recruiting
As of December 31, 2021, we had 13,006 employees (excluding contingent workers), of which 7,847 were installers. Approximately 1,000 of our employees are currently covered by 65 collective bargaining agreements that expire on various dates through 2024. We believe that our relationship with our unions is good.
The residential new construction housing market remained strong through 2021, which continued the shortage of construction industry labor. To attract and retain experienced employees in such a tight labor market, we strive to offer a competitive compensation and benefits program that meets diverse employee needs, such as flexibility in schedule and hybrid workplace opportunities, tuition reimbursement, matching 401k contributions, multiple dental and medical plan options, and paid time off, including for entry-level employees. We continually assess the construction industry and labor market to refine our compensation and benefits program, with the goal of being an employer of choice and maintaining the strength of our workforce.
We take proactive steps to recruit construction labor, including our Friends and Family Referral Program which we introduced in the second half of 2020. This program has been very successful, leading to the hiring and retention of 1,192 installers in 2021. In addition to hiring directly from the local communities in which our branches operate, we leverage our national employer brand to partner with organizations that help engage talent with diverse backgrounds, including veterans, refugees, and trade students.
To build a pipeline of leadership talent, we recruit internally and externally into our Manager in Training program, which fosters development of participants into leaders of our company and high performers in our industry. The program lasts 12-24 months and participants are supported by our executive management team as they are immersed in all aspects of our operations and directly serve and support our customers and suppliers. At any time, we have 15-20 employees enrolled in our Manager in Training program and, upon completion of the program, they are promoted into branch leadership roles within our company.
8
Diversity and Inclusion
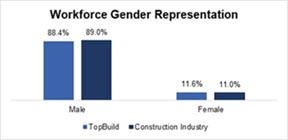
We are taking steps as an employer to champion diversity and inclusion. As of December 31, 2021, our employees self-identified as 43.1% Hispanic, 38.6% White, 7.6% Black, and 10.7% Other or Undisclosed. Our employees represent a higher racial diversification in comparison to both the construction industry and the total U.S. workforce, as reported by the Bureau of Labor Statistics (December 2021). In addition, our workforce gender representation as of December 31, 2021 was comparable to the U.S. construction industry. Our corporate leadership team (Managers and above) self-identifies as approximately 45% female and 19% non-white or undisclosed.
|
| |
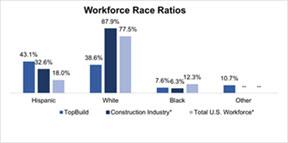
*Sums to >100% due to multi-racial reporting.
We acknowledge and are committed to respecting and upholding the human rights and dignity of all individuals within our operations. We have adopted a company-wide Human Rights policy, which is designed to promote a workplace that values and respects the contributions and perspectives of all employees from a variety of backgrounds, skills, and experiences. Company policies, including the Human Rights Policy, are published in the ESG section of our website.
Community Involvement
We aim to give back to the communities in which we live and work, and we believe this goal helps us attract and retain employees. Guided by our strong values and a spirit of service, we have established long-term partnerships with Habitat for Humanity and The Salvation Army. We host an annual fundraiser for Habitat for Humanity and have raised a total of $2M in the last 5 years through this event alone. Our branches also support their local affiliates throughout the year by donating material and volunteering for Habitat for Humanity builds around the country. In addition to supporting Habitat for Humanity, we are also a sponsor of the Salvation Army’s Angel Tree initiative, which provides new clothing and toys to families in need each year during the holiday season. We also partnered closely with the NASCAR foundation in 2021, and sponsored playset builds for pediatric cancer patients. Finally, for the 4th year running, we sponsored Payit4ward’s annual back to school drive over the summer, which provided supplies and backpacks to thousands of children. These efforts positively impact our teams and their local communities, while showcasing two of our core values – Unity and Community.
Employee Feedback
Employee satisfaction with and engagement in our workplace is important to us as we continue to establish and develop our initiatives to create a positive employee experience. We conduct an employee survey bi-annually, most recently in 2021, and 62% of our employees responded. Our engagement index score was 84%. This score is made up of key questions related to pride in the company, sense of accomplishment, and intent to stay. We shared the results with our leadership at all levels and locations and with our Board. The leaders reviewed areas of satisfaction and dissatisfaction and worked with their teams to prioritize actions and activities in response. Overall areas of strength include employee perception of a solid culture of safety within our company and satisfaction with our company’s direction and culture.
Executive Officers
Set forth below is information about our executive officers. There are no family relationships among any of the officers named below.
9
Robert M. Buck, age 52
| ● | Chief Executive Officer and President since January 1, 2021 |
| ● | President and Chief Operating Officer from June 2015 – December 2020 |
| ● | Group Vice President of Masco from 2014 – June 2015, responsible for the Installation and Other Services Segment consisting of both Masco Contractor Services and Specialty Distribution |
| ● | President of Masco Contractor Services from 2009 – 2014 |
John S. Peterson, age 63
| ● | Vice President and Chief Financial Officer since June 2015 |
| ● | Executive Vice President, Chief Financial Officer of Masco Contractor Services from November 2010 – June 2015 |
| ● | Chief Financial Officer of Masco Retail Cabinet Group, from 2006 – 2010 |
Luis F. Machado, age 59
| ● | Vice President, General Counsel and Corporate Secretary since August 2020 |
| ● | Vice President, General Counsel and Secretary of CTS Corporation from 2015 – August 2020 |
| ● | Senior Vice President, Legal, and Assistant Secretary of L Brands, Inc. from 2010 – 2015 |
Jennifer J. Shoffner, age 49
| ● | Chief Human Resources Officer since August 2020 |
| ● | Vice President, Talent Management from February 2020 – August 2020 |
| ● | Vice President, Human Resources of Liberty Hardware, a Masco Company, from 2006 – 2011 and 2013 – January 2020 |
Robert M. Kuhns, age 48
| ● | Vice President, Controller since July 2018 |
| ● | Senior Director, Assistant Corporate Controller of Mohawk Industries, Inc. from July 2015 – July 2018 |
| ● | Senior Director, International Finance of Mohawk Industries, Inc. from March 2013 – July 2015 |
Steven P. Raia, age 66
| ● | President, TruTeam Operations since March 2019 |
| ● | Senior Vice President of Operations, from November 2015 – March 2019 |
| ● | Various operations management and roles in insulation businesses prior to 2015 |
Robert J. Franklin, age 62
| ● | President, Service Partners Operations since September 2019 |
| ● | Vice President of Operations, TruTeam from 2017 – September 2019 |
| ● | Regional Leader, TruTeam from 2015 – 2016 |
| ● | Various operations management and roles in insulation businesses prior to 2015 |
10
Legislation and Regulation
We are subject to U.S. federal, state, and local regulations, particularly those pertaining to health and safety (including protection of employees and consumers), labor standards/regulations, contractor licensing, and environmental issues. In addition to complying with current effective requirements and requirements that will become effective at a future date, even more stringent requirements could eventually be imposed on our industries. Additionally, some of our products and services may require certification by industry or other organizations. Compliance with these regulations and industry standards may require us to alter our specialty distribution and installation processes and our sourcing, which could adversely impact our competitive position. Further, if we do not effectively and timely comply with such regulations and industry standards, our operating results could be negatively affected.
Additional Information
We provide our Annual Reports, Quarterly Reports, Current Reports and amendments to those reports free of charge on our website, www.topbuild.com, as soon as reasonably practicable after these reports are filed with or furnished to the SEC. We also provide Environmental, Social and Governance (“ESG”) information, including with respect to certain safety metrics, on our website. Information contained on our website is not incorporated by reference into this Form 10-K, and you should not consider information contained on our website to be part of this Form 10-K or in deciding whether to purchase shares of our common stock.
Use of our Website to Distribute Material Company Information
We use our website, www.topbuild.com, as a channel of distribution and routinely post important Company information including press releases, investor presentations and financial information. We may also use our website to expedite public access to time-critical information regarding our Company in advance of or in lieu of distributing a press release or a filing with the SEC disclosing the same information. Visitors to our website can also register to receive automatic e-mail and other notifications alerting them when new information is made available.
11
Item 1A. RISK FACTORS
A number of risks and uncertainties could affect our business and cause our actual results to differ from past performance or expected results. We consider the following risks and uncertainties to be those material to our business. If any of these risks occur, our business, financial condition and results of operations could suffer, and the trading price of our common stock could decline. We urge investors to consider carefully the risk factors described below in evaluating the information contained in this Annual Report.
Risks Which May Be Material to Our Business
Risks Relating to Products and Supply Chain
We are dependent on third-party suppliers and manufacturers to provide us with an adequate supply of high-quality products, and the loss of a large supplier or manufacturer could negatively affect our operating results.
Failure by our suppliers to provide us with an adequate supply of high-quality products on commercially reasonable terms, or to comply with applicable legal requirements, could have a material adverse effect on our financial condition or operating results. While we believe that we have positive relationships with our suppliers, the fiberglass insulation industry has encountered both shortages and periods of significant oversupply during past housing market cycles, leading to volatility in prices and allocations of supply, which affect our results. While we do not believe we depend on any sole or limited source of supply, we source the majority of our building products, primarily insulation, from a limited number of large suppliers. The loss of a large supplier, or a substantial decrease in the availability of products or components from our suppliers, could disrupt our business and adversely affect our operating results.
Our profit margins could decrease due to changes in the costs of the products we install and/or distribute.
The principal building products that we install and distribute have been subject to price changes in the past, some of which have been significant. Our results of operations for individual quarters can be, and have been, hurt by a delay between the time building product or material cost increases are implemented and the time we are able to increase prices for our installation or specialty distribution services, if at all. Our supplier purchase prices may depend on our purchasing volume or other arrangements with any given supplier. While we have been able to achieve cost savings through volume purchasing or other arrangements with suppliers in the past, we may not be able to consistently continue to receive advantageous pricing for the products we distribute and install. If we are unable to maintain purchase pricing consistent with prior periods or are unable to pass on price increases, our costs could increase and our margins may be adversely affected.
The development of alternatives to distributors in the supply chain could cause a decrease in our sales and operating results and limit our ability to grow our business.
Our Specialty Distribution customers could begin purchasing more of their products directly from manufacturers, which would result in decreases in our net sales and earnings. Our suppliers could invest in infrastructure to expand their own local sales force and sell more products directly to our Specialty Distribution customers, which also would negatively impact our business.
New product innovations or new product introductions could negatively impact our business.
New product innovations or new product introductions could negatively impact demand for the products we install and distribute.
12
We may not be able to identify new products or new product lines and integrate them into our specialty distribution network, which may impact our ability to compete. Our expansion into new markets may present competitive, distribution, and regulatory challenges that differ from current ones.
Our business depends, in part, on our ability to identify future products and product lines that complement existing products and product lines and that respond to our customers’ needs. We may not be able to compete effectively unless our product selection keeps up with trends in the markets in which we compete, or trends in new products, which could cause us to lose market share. Our expansion into new markets, new products, or new product lines may present competitive, distribution and regulatory challenges, as well as divert management’s attention away from our core business. In addition, our ability to integrate new products and product lines into our specialty distribution network could affect our ability to compete.
Risks Relating to Potential Closures due to Events Beyond Our Control
Events beyond our control may negatively impact demand for our services or the products we distribute.
A variety of events uncontrollable by us may reduce demand for our services or the products that we distribute, impair our ability to deliver our services or products on schedule, or increase the cost of delivering our services or products. Demand for our services or products is dependent on a variety of macroeconomic factors, such as employment levels, interest rates, changes in stock market valuations, consumer confidence, housing demand, availability of financing for home buyers, availability and prices of new homes compared to existing inventory, and demographic trends. These factors, in particular consumer confidence, can be significantly adversely affected by a variety of factors beyond our control, including: catastrophic events or natural disasters (such as hurricanes, floods, wildfires, earthquakes, droughts, excessive heat or rain, epidemics, pandemics, and terrorist attacks); international, political or military developments; and significant volatility in debt and equity markets. Certain of these events can also have a serious impact on our customer’s ability to develop residential communities or commercial projects, could cause delays in, prevent the completion of, or increase the cost of, developing one or more of them, or could negatively impact our industrial customers’ utilization of their facilities, any of which in turn could harm our sales and results of operations.
The ongoing COVID-19 Pandemic may cause further business and market disruptions, impacting demand for our services or the products we distribute, our ability to provide services, or our results of operations or financial condition.
There remains significant uncertainty around the breadth and duration of business disruptions related to COVID-19, as well as its impact on the U.S. economy and consumer confidence. The extent to which COVID-19 impacts our results will continue to depend on future developments, which are highly uncertain and cannot be predicted, including new information which may emerge concerning the severity of COVID-19, new or additional strains of COVID-19, and the actions taken to contain it or treat its impact. While we have not seen a significant impact on our business resulting from COVID-19 to date, if the virus causes significant negative impacts to economic conditions or consumer confidence, our results of operations and financial condition could be adversely impacted. While we are currently able to operate in all of our locations, there is no guarantee that the services we provide will continue to be allowed or that other events making the provision of our services challenging or impossible, will not occur. For example, if there are surges in levels of COVID-19 infections in certain states, those states may respond by, among other things, deeming residential and commercial construction as nonessential or limiting or restricting the ability of our labor force to travel or perform their job function.
Risks Relating to Human Capital
The long-term performance of our businesses relies on our ability to attract, develop, and retain talented personnel, including sales representatives, branch managers, installers, and truck drivers, while controlling our labor costs.
We are highly dependent on the skills and experience of our senior management team and other skilled and experienced personnel. The failure to attract and retain key employees could negatively affect our competitive position and operating results.
13
Our business results also depend upon our branch managers and sales personnel, including those of businesses acquired. Our ability to control labor costs and attract qualified labor is subject to numerous external factors including prevailing wage rates, the labor market, the demand environment, the impact of legislation or regulations governing wages and hours, labor relations, immigration, healthcare benefits, and insurance costs. In addition, we compete with other companies to recruit and retain qualified installers and truck drivers in a tight labor market, and we invest significant resources in training and motivating them to maintain a high level of job satisfaction. These positions generally have high turnover rates, which can lead to increased training and retention costs. If we fail to attract qualified labor on favorable terms, we may not be able to meet the demand of our customers, which could adversely impact our business, financial condition, and results of operations.
Changes in employment and immigration laws may adversely affect our business.
Various federal and state labor laws govern the relationship with our employees and impact operating costs. These laws include:
| ● | employee classification as exempt or non-exempt for overtime and other purposes; |
| ● | workers’ compensation rates; |
| ● | immigration status; |
| ● | mandatory health benefits; |
| ● | tax reporting; and |
| ● | other wage and benefit requirements. |
We have a significant exposure to changes in laws governing our relationships with our employees, including wage and hour laws and regulations, fair labor standards, minimum wage requirements, overtime pay, unemployment tax rates, workers’ compensation rates, citizenship requirements, and payroll taxes, as well as vaccination and testing mandates which may be imposed in connection with the occurrence of pandemic or health concerns, which changes would have a direct impact on our operating costs. Significant additional government-imposed increases in the preceding areas could have a material adverse effect on our business, financial condition, and results of operations.
In addition, various states in which we operate are considering or have already adopted new immigration laws or enforcement programs, and the U.S. Congress and Department of Homeland Security from time to time consider and implement changes to federal immigration laws, regulations, or enforcement programs. These changes may increase our compliance and oversight obligations, which could subject us to additional costs and make our hiring process more cumbersome, or reduce the availability of potential employees. Although we verify the employment eligibility status of all our employees, including through participation in the “E-Verify” program where required, some of our employees may, without our knowledge, be unauthorized workers. Use of the verification tools and/or “E-Verify” program does not guarantee that we will properly identify all applicants who are ineligible for employment. Unauthorized workers are subject to deportation and may subject us to fines or penalties and, if any of our workers are found to be unauthorized, we could experience adverse publicity that negatively impacts our brand and may make it more difficult to hire and retain qualified employees, which could disrupt our operations. We could also become subject to fines, penalties, and other costs related to claims that we did not fully comply with all recordkeeping obligations of federal and state immigration laws. These factors could have a material adverse effect on our business, financial condition, and results of operations.
14
Union organizing activity and work stoppages could delay or reduce availability of products that we install and increase our costs.
Approximately 1,000 of our employees are currently covered by collective bargaining or other similar labor agreements that expire on various dates through 2024. Any inability by us to negotiate collective bargaining arrangements could cause strikes or other work stoppages, and new contracts could result in increased operating costs. If any such strikes or other work stoppages occur, or if other employees become represented by a union, we could experience a disruption of our operations and higher labor costs. Further, if a significant number of additional employees were to unionize, including in the wake of any future legislation or regulation that makes it easier for employees to unionize, these risks would increase. In addition, certain of our suppliers have unionized work forces, and certain of the products we install and/or distribute are transported by unionized truckers. Strikes, work stoppages, or slowdowns could result in slowdowns or closures of facilities where the products that we install and/or distribute are manufactured, or could affect the ability of our suppliers to deliver such products to us. Any interruption in the production or delivery of these products could delay or reduce availability of these products and increase our costs.
Our business relies significantly on the expertise of our employees and we generally do not have intellectual property that is protected by patents.
Our business is significantly dependent upon our expertise in installation and distribution logistics, including significant expertise in the application of building science through our Environments for Living® program. We rely on a combination of trade secrets and contractual confidentiality provisions and, to a much lesser extent, copyrights and trademarks, to protect our proprietary rights. Accordingly, our intellectual property is more vulnerable than it would be if it were protected primarily by patents. We may be required to spend significant resources to monitor and protect our proprietary rights, and in the event a misappropriation or breach of our proprietary rights occurs, our competitive position in the market may be harmed. In addition, competitors may develop competing technologies and expertise that renders our expertise obsolete or less valuable.
Risks Relating to Mergers and Acquisitions
We may not be successful in identifying and making acquisitions. In addition, acquisition integrations involve risks that could negatively affect our operating results, cash flows, and liquidity.
We have made, and in the future may continue to make, strategic acquisitions as part of our growth strategy. We may be unable to make accretive acquisitions or realize expected benefits of any acquisitions for any of the following reasons:
| ● | failure to identify attractive targets in the marketplace; |
| ● | increased competition for attractive targets; |
| ● | incorrect assumptions regarding the future results of acquired operations or assets, expected cost reductions, or other synergies expected to be realized as a result of acquiring operations or assets; |
| ● | failure to obtain acceptable financing; or |
| ● | restrictions in our debt agreements. |
Our ability to successfully implement our business plan and achieve targeted financial results is dependent on our ability to successfully integrate acquired businesses including, without limitation, our recent acquisition of DI. The process of integrating acquired businesses, may expose us to operational challenges and risks, including, but not limited to:
| ● | the ability to profitably manage acquired businesses or successfully integrate the acquired business’ operations, financial reporting, and accounting control systems into our business; |
| ● | the expense of integrating acquired businesses; |
15
| ● | increased indebtedness; |
| ● | the loss of installers, suppliers, customers or other significant business partners of acquired businesses; |
| ● | the ability to fund cash flow shortages that may occur if anticipated revenue is not realized or is delayed, whether by general economic or market conditions, or unforeseen internal difficulties; |
| ● | the availability of funding sufficient to meet increased capital needs; |
| ● | potential impairment of goodwill and other intangible assets; |
| ● | risks associated with the internal controls and accounting policies of acquired businesses; |
| ● | diversion of management’s attention due to the increase in the size of our business; |
| ● | difficulties in the assimilation of different corporate cultures and business practices; |
| ● | the ability to retain vital employees or hire qualified personnel required for expanded operations; |
| ● | failure to identify all known and contingent liabilities during due diligence investigations; and |
| ● | the indemnification granted to us by sellers of acquired companies may not be sufficient. |
Failure to successfully integrate any acquired business may result in reduced levels of revenue, earnings, or operating efficiency than might have been achieved if we had not acquired such business. In addition, our past acquisitions results, and any future acquisitions could result in the incurrence of additional debt and related interest expense, contingent liabilities, and amortization expenses related to intangible assets, which could have a material adverse effect on our financial condition, operating results, and cash flow.
We may not be able to achieve the benefits that we expect to realize as a result of future acquisitions. Failure to achieve such benefits could have an adverse effect on our financial condition and results of operations.
We may not be able to realize anticipated cost savings, revenue enhancements, or other synergies from future acquisitions, either in the amount or within the time frame that we expect. In addition, the costs of achieving these benefits may be higher than, and the timing may differ from, what we expect. Our ability to realize anticipated cost savings, synergies, and revenue enhancements may be affected by a number of factors, including, but not limited to, the following:
| ● | the use of more cash or other financial resources on integration and implementation activities than we expect; |
| ● | unanticipated increases in expenses unrelated to any future acquisition, which may offset the expected cost savings and other synergies from any future acquisition; |
| ● | our ability to eliminate duplicative back office overhead and redundant selling, general, and administrative functions; and |
| ● | our ability to avoid labor disruptions in connection with the integration of any future acquisition, particularly in connection with any headcount reduction. |
While we expect future acquisitions to create opportunities to reduce our combined operating costs, these cost savings reflect estimates and assumptions made by our management, and it is possible that our actual results will not reflect these estimates and assumptions within our anticipated timeframe or at all.
16
If we fail to realize anticipated cost savings, synergies, or revenue enhancements, our financial results may be adversely affected, and we may not generate the cash flow from operations that we anticipate.
Risks Relating to Legal and Regulatory Matters
Because we operate our business through highly dispersed locations across the U.S. and Canada, our operations may be materially adversely affected by inconsistent local practices, and the operating results of individual branches and centers may vary.
We operate our business through a network of highly dispersed locations throughout the United States and Canada, supported by executives and services at our Branch Support Center in Daytona Beach, Florida, with local branch management retaining responsibility for day-to-day operations and adherence to applicable local laws. Our operating structure can make it difficult for us to coordinate procedures across our operations. In addition, our branches and distribution facilities may require significant oversight and coordination from headquarters to support their growth. Inconsistent implementation of corporate strategy and policies at the local or regional level could materially and adversely affect our business, financial condition, results of operations, and cash flows.
Claims and litigation could be costly.
We are, from time to time, involved in various claims, litigation matters, and regulatory proceedings that arise in the ordinary course of our business and which could have a material adverse effect on us. These matters may include contract disputes, automobile liability and other personal injury claims, warranty disputes, environmental claims or proceedings, other tort claims, employment and tax claims, claims relating to the quality of products sourced from our suppliers, and other proceedings and litigation, including class actions. In addition, we are exposed to potential claims by our employees or others based on job related hazards.
We may also be subject to claims or liabilities arising from our acquisitions for the periods prior to our acquisition of them, including environmental, employee-related, and other liabilities and claims not covered by insurance. Our ability to seek indemnification from the former owners of our acquired businesses for these claims or liabilities may be limited by the respective acquisition agreements and the financial ability of the former owners to satisfy our indemnification claims.
Our builder and contractor customers are subject to product liability, casualty, negligence, construction defect, breach of contract, warranty, and other claims in the ordinary course of their business. Our contractual arrangements with our builder and contractor customers may include our agreement to defend and indemnify them against various liabilities.
We rely on manufacturers and other suppliers to provide us with most of the products we install. Because we do not have direct control over the quality of products manufactured or supplied by third-party suppliers, we are exposed to risks relating to the quality of those products. In addition, we are exposed to potential claims arising from the conduct of our employees, homebuilders, and other subcontractors, for which we may be liable contractually or otherwise.
Product liability, workmanship warranty, casualty, negligence, construction defect, breach of contract, and other claims and legal proceedings can be expensive to defend and can divert the attention of management and other personnel for significant periods of time, regardless of fault or the ultimate outcome. In addition, lawsuits relating to construction defects typically have statutes of limitations that can run as long as ten years. Claims of this nature could also have a negative impact on customer confidence in us and our services.
Although we intend to defend all claims and litigation matters vigorously, given the inherently unpredictable nature of claims and litigation, we cannot predict with certainty the outcome or effect of any claim or litigation matter.
We expect to maintain insurance against some, but not all, of our risks of loss resulting from claims and litigation. We may elect not to obtain insurance if we believe the cost of available insurance is excessive relative to the risks presented. The levels of insurance we maintain may not be adequate to fully cover any and all losses or liabilities. If any significant accident, judgment, claim, or other event is not fully insured or indemnified against, it could have a material adverse impact on our business, financial condition, and results of operations.
17
Compliance with government regulation and industry standards could impact our operating results.
We are subject to federal, state, provincial, and local government regulations, particularly those pertaining to health and safety, including protection of employees and consumers, employment laws, including immigration and wage and hour regulations, contractor licensing, data privacy, and environmental issues. In addition to complying with current requirements, even more stringent requirements could be imposed in the future. Compliance with these regulations and industry standards is costly and may require us to alter our installation and distribution processes, product sourcing, or business practices, and makes recruiting and retaining labor in a tight labor market more challenging. Compliance with these regulations and industry standards could also divert our attention and resources to compliance activities and could cause us to incur higher costs. Further, if we do not effectively and timely comply with such regulations and industry standards, our results of operations could be negatively affected, and we could become subject to substantial penalties or other legal liability.
We are subject to environmental regulation and potential exposure to environmental liabilities.
We are subject to various federal, state, provincial, and local environmental laws and regulations. Although we believe that we operate our business, including each of our locations, in compliance with applicable laws and regulations and maintain all material permits required under such laws and regulations to operate our business, we may be held liable or incur fines or penalties in connection with such requirements. In addition, environmental laws and regulations, including those related to energy use and climate change, may become more stringent over time, and any future laws and regulations could have a material impact on our operations or require us to incur material additional expenses to comply with any such future laws and regulations.
Changes in building codes and consumer preferences could affect our ability to market our service offerings and our profitability. Moreover, if we do not respond to evolving customer preferences or changes in building standards, or if we do not maintain or expand our leadership in building science, our business, results of operation, financial condition, and cash flow would be adversely affected.
Each of our lines of business is impacted by building codes and consumer preferences, including a growing focus on energy efficiency. Our competitive advantage is due, in part, to our ability to respond to changes in consumer preferences and building codes. However, if our installation and distribution services and our leadership in building sciences do not adequately or quickly adapt to changing preferences and building standards, we may lose market share to competitors, which would adversely affect our business, results of operation, financial condition, and cash flows. Further, our growth prospects could be harmed if consumer preferences and building standards evolve more slowly than we anticipate towards energy efficient service offerings, which are more profitable than minimum code service offerings.
Risks Relating to the Industry in Which We Operate
Our business relies on residential new construction activity, and to a lesser extent on residential repair/remodel, commercial construction activity, and industrial manufacturing activity, all of which are cyclical.
Demand for our services is cyclical and highly sensitive to general macroeconomic and local economic conditions over which we have no control. Macroeconomic and local economic conditions, including consumer confidence levels, fluctuations in home prices, unemployment and underemployment levels, income and wage growth, student loan debt, household formation rates, mortgage tax deduction limits, the age and volume of the housing stock, the availability of home equity loans and mortgages and the interest rates for such loans, and other factors, affect consumers’ discretionary spending on both residential new construction projects and residential repair/remodel activity. The commercial construction market is affected by macroeconomic and local economic factors such as interest rates, credit availability for commercial construction projects, material costs, employment rates, and vacancy and absorption rates. The industrial construction market is affected by macroeconomic and local economic factors such as economic expansion, import and export activity, cost of financing, technological advances, demand for products and services, and manufacturing capacity. Changes or uncertainty regarding these and similar factors could adversely affect our results of operations and our financial position.
18
We face significant competition, and increased competitive pressure may adversely affect our business, financial condition, results of operations and cash flows.
The market for the specialty distribution and installation of building products and materials is highly fragmented and competitive, and barriers to entry are relatively low. Our Installation competitors include national contractors, regional contractors, and local contractors, and we face many or all of these competitors for each project on which we bid. Our Specialty Distribution competitors include numerous specialty insulation distributors. In some instances, our Specialty Distribution business sells products to companies that may compete directly with our installation service business. We also compete with broad line building products distributors, big box retailers, and insulation manufacturers. In addition to price, we believe that competition in our industry is based largely on existing customer relationships, customer service and the quality and timeliness of installation services and distribution product deliveries in each local market. In the event that increased demand leads to higher prices for the products we sell and install, we may have limited ability to pass on price increases in a timely manner, or at all, due to the fragmented and competitive nature of our industry.
Our business is seasonal and is susceptible to adverse weather conditions and natural disasters. We also may be adversely affected by any natural or man-made disruptions to our facilities.
We normally experience stronger sales during the third and fourth calendar quarters, corresponding with the peak season for residential new construction and residential repair/remodel activity. Sales during the winter weather months are seasonally slower due to the lower construction activity. Historically, the installation of insulation lags housing starts by several months. In addition, to the extent that hurricanes, severe storms, earthquakes, droughts, floods, fires, other natural disasters, or similar events occur in the geographic areas in which we operate, our business may be adversely affected. Any widespread disruption to our facilities resulting from a natural disaster, an act of terrorism, or any other cause could materially impair our ability to provide installation and/or distribution services for our customers.
We are subject to competitive pricing pressure from our customers.
Residential homebuilders historically have exerted significant pressure on their outside suppliers to keep prices low in the highly fragmented building products and materials supply and services industry. In addition, consolidation among homebuilders and changes in homebuilders’ purchasing policies or payment practices could result in additional pricing pressure.
Risks Relating to Our Operations Outside of the United States
We face risks relating to our operations outside of the United States.
A portion of our operations are conducted in Canada. As a result, our operating results and financial condition could be materially adversely affected by economic, political, health, regulatory and other factors existing outside of the United States. Our foreign operations are subject to inherent risks, which may materially adversely affect us, including: political and economic changes or instability; expropriation or the imposition of government controls; changes in government regulations; export requirements; trade restrictions; earnings repatriation and expatriation restrictions; exposure to different legal standards, including related to intellectual property and data privacy; health conditions and standards; currency controls; fluctuations in exchange rates; increases in the duties and taxes we pay; inflation or deflation; greater difficulty in collecting accounts receivable and longer payment cycles; changes in labor conditions, staffing, and managing our foreign operations; limitations on insurance coverage against geopolitical risks, natural disasters, and business operations; and communication among management and foreign operations. In addition, these same factors may also place us at a competitive disadvantage compared to foreign competitors.
19
FCPA Risk
We may face risks associated with violations of the Foreign Corrupt Practices Act (“FCPA”) and similar anti-bribery laws. The FCPA and similar anti-bribery laws in other jurisdictions generally prohibit companies and their intermediaries from making improper payments to government officials for the purpose of obtaining or retaining business. Our Code of Ethics mandates compliance with these anti-bribery laws. We cannot assure you that our internal controls and procedures will always protect us from the detrimental actions by our employees or agents. If we are found to be liable for FCPA violations (either due to our own acts or inadvertence or due to the acts or inadvertence of others), we could suffer from criminal or civil penalties or other sanctions, which could have a material adverse effect on our business.
We are exposed to fluctuations in foreign currency exchange rates that may adversely affect our business, financial condition, and operating results.
We transact business outside of the United States. We present our consolidated financial statements in U.S. dollars, but a portion of our revenues and expenditures are transacted in other currencies. As a result, we are exposed to fluctuations in foreign currencies. Additionally, we may have currency exposure arising from funds held in currencies other than U.S. dollars. Volatility in the exchange rates between the foreign currencies and the U.S. dollar could materially harm our business, financial condition, or operating results.
Risks Relating to Information Technology and Cybersecurity
We rely on information technology systems, and in the event of a disruption or security incident, we could experience problems with customer service, inventory, collections, and cost control and incur substantial costs to address related issues.
Our operations are dependent upon our information technology systems, including systems run by third-party vendors which we do not control, to manage customer orders on a timely basis, to coordinate our installation and specialty distribution activities across locations, and to manage invoicing. If we experience problems with our information technology systems, we could experience, among other things, delays in receiving customer orders, placing orders with suppliers, and scheduling production, installation services, deliveries, or shipments.
A substantial disruption in our information technology systems could have an adverse impact on revenue, harm our reputation, and cause us to incur legal liability and costs, which could be significant, to address and remediate such events and related security concerns.
In addition, we could be adversely affected if any of our significant customers or suppliers experienced any similar events that disrupted their respective business operations or damaged their reputations.
In the event of a cybersecurity incident, we could experience operational interruptions, incur substantial additional costs, become subject to legal or regulatory proceedings or suffer damage to our reputation.
In addition to the disruptions that may occur from interruptions in our information technology systems, cybersecurity threats and sophisticated and targeted cyberattacks pose a risk to our information technology systems. We have established security policies, processes and defenses designed to help identify and protect against intentional and unintentional misappropriation or corruption of our information technology systems and disruption of our operations. Despite these efforts, our information technology systems may be damaged, disrupted or shut down due to attacks by unauthorized persons, malicious software, computer viruses, undetected intrusion, hardware failures, or other events, and in these circumstances our disaster recovery plans may be ineffective or inadequate. These breaches or intrusions could lead to business interruptions, exposure of proprietary or confidential information, data corruption, damage to our reputation, exposure to legal and regulatory proceedings, and other costs. Such events could have a material adverse impact on our financial condition, results of operations and cash flows. In addition, we could be adversely affected if any of our significant customers or suppliers experience any similar events that disrupt their business operations or damage their reputations.
20
We maintain monitoring practices and protections of our information technology to reduce these risks and test our systems on an ongoing basis for potential threats. We carry cybersecurity insurance to help mitigate the financial exposure and related notification procedures in the event of intentional intrusion. There can be no assurance, however, that our efforts will prevent the risk of a security breach of our databases or systems that could adversely affect our business.
Risks Relating to Liquidity and Our Ability to Finance Our Operations
If we are required to take significant non-cash charges, our financial resources could be reduced, and our financial flexibility may be negatively affected.
We have significant goodwill and other intangible assets related to business combinations on our balance sheet. The valuation of these assets is largely dependent upon the expectations for future performance of our businesses. Expectations about the growth of residential new construction, commercial construction, residential repair/remodel activity, and the utilization of industrial facilities, may impact whether we are required to recognize noncash, pretax impairment charges for goodwill and other indefinite lived intangible assets, or other long-lived assets. If the value of our goodwill, other intangible assets, or long-lived assets is further impaired, our earnings and stockholders’ equity would be adversely affected and may impact our ability to raise capital in the future.
We may have future capital needs and may not be able to obtain additional financing on acceptable terms.
Our future capital requirements will depend on many factors, including industry and market conditions, our ability to successfully complete future business combinations and the expansion of our existing operations. We anticipate that we may need to raise additional funds in order to grow our business and implement our business strategy. Economic and credit market conditions, the performance of the construction industry, and our financial performance, as well as other factors may constrain our financing abilities. Our ability to secure additional financing and to satisfy our financial obligations will depend upon our future operating performance, the availability of credit, economic conditions, and financial, business, and other factors, many of which are beyond our control. Any financing, if available, may be on terms that are not favorable to us and will be subject to changes in interest rates and the capital markets environment. If we cannot obtain adequate capital, we may not be able to fully implement our business strategy and our business, operational results and financial condition could be adversely affected.
Our indebtedness and restrictions in our existing credit facility, Senior Notes or any other indebtedness we may incur in the future, could adversely affect our business, financial condition, results of operations, ability to make distributions to shareholders, and the value of our common stock.
Our indebtedness could have significant consequences on our future operations, including:
| ● | making it more difficult for us to meet our payments and other obligations; |
| ● | reducing the availability of our cash flows to fund working capital, capital expenditures, acquisitions or strategic investments and other general corporate requirements, and limiting our ability to obtain additional financing for these purposes; |
| ● | subjecting us to increased interest expense related to our indebtedness with variable interest rates, including borrowings under our credit facility; |
| ● | limiting our flexibility in planning for, or reacting to, and increasing our vulnerability to changes in our business, the industry in which we operate and the general economy; and |
| ● | placing us at a competitive disadvantage compared to our competitors that have less debt or are less leveraged. |
21
Any of the above-listed factors could have an adverse effect on our business, financial condition, results of operations, or ability to meet our payment obligations. If we are not able to generate sufficient cash flow to service our debt obligations, we may need to refinance or restructure our debt, sell certain assets, reduce or delay capital investments, or seek to raise additional capital, and some of these activities may be on terms that are unfavorable or highly dilutive. Our ability to refinance our indebtedness will depend on the capital markets and our financial condition at such time. If we are unable to implement one or more of these alternatives, we may not be able to meet our payment obligations.
Certain of our variable rate indebtedness uses LIBOR as a benchmark for establishing the rate of interest. LIBOR is the subject of recent national, international and other regulatory guidance and proposals for reform. These reforms and other pressures will cause LIBOR to be replaced with a new benchmark which may perform differently than LIBOR. The consequences of these developments cannot be entirely predicted, but could include an increase in the cost of our variable rate indebtedness.
Our existing term loan, revolving credit facility and the indentures governing our Senior Notes limit, and any future credit facility or other indebtedness we enter into may limit our ability to, among other things:
| ● | incur or guarantee additional debt; |
| ● | make distributions or dividends on, or redeem or repurchase shares of our common stock; |
| ● | make certain investments, acquisitions, or other restricted payments; |
| ● | incur certain liens or permit them to exist; |
| ● | acquire, merge, or consolidate with another company; and |
| ● | transfer, sell, or otherwise dispose of substantially all of our assets. |
Our revolving credit facility contains, and any future credit facility or other debt instrument we may enter into will also likely contain, covenants requiring us to maintain certain financial ratios and meet certain tests, such as an interest coverage ratio, a leverage ratio, and a minimum test. Our ability to comply with those financial ratios and tests can be affected by events beyond our control, and we may not be able to comply with those ratios and tests when required to do so under the applicable debt instruments. For additional information regarding our outstanding debt see Item 8. Financial Statements and Supplementary Data – Note 6. Long-Term Debt.
Adverse credit ratings could increase our costs of borrowing money and limit our access to capital markets and commercial credit.
Moody’s Investor Service and Standard & Poor’s routinely evaluate our credit ratings related to our Senior Notes. If these rating agencies downgrade any of our current credit ratings, our borrowing costs could increase and our access to the capital and commercial credit markets could be adversely affected.
In connection with the Separation, Masco indemnified us for certain liabilities, and we indemnified Masco for certain liabilities. If we are required to act under these indemnities to Masco, we may need to divert cash to meet those obligations, which could adversely affect our financial results. Moreover, the Masco indemnity may not be sufficient to compensate us for the full amount of liabilities for which it may be liable, and Masco may not be able to satisfy its indemnification obligations to us in the future.
Indemnities that we may be required to provide Masco are not subject to any cap, may be significant, and could negatively affect our business, particularly indemnities relating to our actions that could affect the tax-free nature of the Separation. Third parties could also seek to hold us responsible for any of the liabilities that Masco has agreed to retain, and under certain circumstances, we may be subject to continuing contingent liabilities of Masco following the Separation, such as certain shareholder litigation claims. Further, Masco may not be able to fully satisfy its indemnification obligations, or such indemnity obligations may not be sufficient to cover our liabilities. Moreover, even if we ultimately succeed in recovering from Masco any amounts for which we are held liable, we may be temporarily required to bear these losses ourselves. Each of these risks could negatively affect our business, results of operations, liquidity, and financial condition.
22
Compliance with and changes in tax laws could adversely affect our performance.
We are subject to extensive tax liabilities imposed by multiple jurisdictions including income taxes; indirect taxes which include excise and duty, sales and use, and gross receipts taxes; payroll taxes; franchise taxes; withholding taxes; and ad valorem taxes. New tax laws and regulations, and changes in existing tax laws and regulations, are continuously being enacted or proposed which could result in increased expenditures for tax liabilities in the future. Many of these liabilities are subject to periodic audits by the respective taxing authority. Subsequent changes to our tax liabilities as a result of these audits may subject us to interest and penalties.
Risks Relating to Our Common Stock
The price of our common stock may fluctuate substantially, and the value of your investment may decline.
The market price of our common stock could fluctuate significantly due to a number of factors, many of which are beyond our control, including:
| ● | fluctuations in our quarterly or annual earnings results, or those of other companies in our industry; |
| ● | failures of our operating results to meet our published guidance, the estimates of securities analysts or the expectations of our stockholders, or changes by securities analysts in their estimates of our future earnings; |
| ● | announcements by us or our customers, suppliers, or competitors; |
| ● | changes in laws or regulations which adversely affect our industry or us; |
| ● | changes in accounting standards, policies, guidance, interpretations, or principles; |
| ● | general economic, industry, and stock market conditions; |
| ● | future sales of our common stock by our stockholders; |
| ● | future issuances of our common stock by us; and |
| ● | other factors described in these “Risk Factors” and elsewhere in this Annual Report. |
Provisions in our certificate of incorporation and bylaws, and certain provisions of Delaware law, could delay or prevent a change in control.
The existence of some provisions of our certificate of incorporation and bylaws and Delaware law could discourage, delay, or prevent a change in control that a stockholder may consider favorable. These include provisions:
| ● | authorizing a large number of shares of stock that are not yet issued, which could have the effect of preventing or delaying a change in control if our board of directors issued shares to persons that did not support such change in control, or which could be used to dilute the stock ownership of persons seeking to obtain control; and |
| ● | prohibiting stockholders from calling special meetings of stockholders or taking action by written consent. |
In addition, we are subject to Section 203 of the Delaware General Corporation Law, which may have an anti-takeover effect with respect to transactions not approved in advance by our board of directors, including discouraging takeover attempts that could have resulted in a premium over the market price for shares of our common stock.
23
These provisions apply even if a takeover offer is considered beneficial by some stockholders and could delay or prevent an acquisition that our board of directors determines is not in our and our stockholders’ best interests.
Our bylaws designate the Court of Chancery of the State of Delaware as the sole and exclusive forum for certain types of actions and proceedings that may be initiated by our stockholders, which could limit our stockholders’ ability to obtain a preferred judicial forum for disputes with us or our directors, officers, or other employees.
Our bylaws provide that, unless we consent in writing to the selection of an alternative forum, the sole and exclusive forum for (i) any derivative action or proceeding brought on our behalf, (ii) any action asserting a claim of breach of a fiduciary duty owed by any director, officer, or other employee to us or our stockholders, (iii) any action asserting a claim arising pursuant to any provision of Delaware General Corporation Law, our certificate of incorporation (including any certificate of designations for any class or series of our preferred stock), or our bylaws, in each case, as amended from time to time, or (iv) any action asserting a claim governed by the internal affairs doctrine, shall be the Court of Chancery of the State of Delaware (provided, however, that in the event that the Court of Chancery of the State of Delaware lacks subject matter jurisdiction over such proceeding, the sole and exclusive forum for such action or proceeding shall be another state or federal court located within the State of Delaware), in all cases subject to the court having personal jurisdiction over the indispensable parties named as defendants. Any person or entity purchasing or otherwise acquiring any interest in shares of our capital stock is deemed to have received notice of, and consented to, the foregoing provision. This forum selection provision may limit a stockholder’s ability to bring a claim in a judicial forum that it finds favorable or cost effective for disputes with us or our directors, officers, or other employees, which may discourage such lawsuits against us and our directors, officers, and employees.
Item 1B. UNRESOLVED STAFF COMMENTS
None.
Item 2. PROPERTIES
We operate approximately 235 Installation branch locations and approximately 175 Specialty Distribution centers in the United States and Canada, most of which are leased. Our 65,700 square foot Branch Support Center is located at 475 North Williamson Boulevard in Daytona Beach, FL 32114. This lease expires in June 2029, assuming no exercise of any options set forth in the lease. We believe that our facilities have sufficient capacity and are adequate for our installation and specialty distribution requirements.
Item 3. LEGAL PROCEEDINGS
For information regarding legal proceedings, see Item 8. Financial Statements and Supplementary Data – Note 11. Other Commitments and Contingencies, which we incorporate herein by reference.
Item 4. MINE SAFETY DISCLOSURES
Not applicable.
24
PART II
Item 5. MARKET FOR REGISTRANT’S COMMON EQUITY, RELATED STOCKHOLDER MATTERS, AND ISSUER PURCHASES OF EQUITY SECURITIES
Market Information and Holders of our Common Stock. Our common stock is traded on the NYSE under the symbol “BLD”. As of February 14, 2022, there were approximately 1,719 holders of our issued and outstanding common stock.
Dividends. No dividends were paid during the years ended December 31, 2021 and 2020. Our Credit Agreement, in certain circumstances, limits the amount of dividends we may distribute. We do not anticipate declaring cash dividends to holders of our common stock in the foreseeable future.
Issuer Purchases of Equity Securities. There were no repurchases of our common stock during the three months ended December 31, 2021. We have $204.4 million of shares remaining under for repurchase under our 2019 and 2021 Share Repurchase Programs. Excluded from this disclosure are shares repurchased to settle statutory employee tax withholdings related to the vesting of stock awards.
Item 6. [Reserved]
25
Item 7. MANAGEMENT’S DISCUSSION AND ANALYSIS OF FINANCIAL CONDITION AND RESULTS OF OPERATIONS
The financial and business analysis below provides information which we believe is relevant to an assessment and understanding of our financial position, results of operations, and cash flows. This financial and business analysis should be read in conjunction with the financial statements and related notes.
In this section, we generally discuss the results of our operations for the year ended December 31, 2021 compared to the year ended December 31, 2020. For a discussion of the year ended December 31, 2020 to the year ended December 31, 2019, please refer to Part II, Item 7, “Management’s Discussion and Analysis of Financial Condition and Results of Operations” in our Annual Report on Form 10-K for the year ended December 31, 2020, filed with the SEC on February 23, 2021, which discussion is hereby incorporated herein by reference.
Executive Summary
We are a leading installer and distributor of insulation and other building products to the construction industry. Demand for our products and services is driven primarily by residential construction, commercial construction, and industrial construction. We serve the residential, commercial, and industrial markets in the U.S. and the commercial and industrial markets in Canada. A number of local and national factors influence activity in each of our lines of business, including demographic trends, interest rates, employment levels, business investment, supply and demand for housing, availability of credit, foreclosure rates, consumer confidence, and general economic conditions.
Activity in the construction industry is seasonal, typically peaking in the summer months. Because installation of insulation historically lags housing starts by several months, we generally see a corresponding benefit in our operating results during the third and fourth quarters.
Strategy
We are the nation’s leading installer and specialty distributor of residential and commercial insulation and other building products. We are committed to creating long-term value for all stakeholders – employees, customers, suppliers, and investors. Our core values include:
| ● | Safety – We put the safety of our people first. |
| ● | Integrity – We deliver results with integrity, respect, and accountability. |
| ● | Focus – We are customer-focused, grounded in strong relationships. |
| ● | Innovation – We are continuously improving and encourage idea sharing. |
| ● | Unity – We are united as one team, valuing diversity. |
| ● | Community – We make a difference in the communities we serve. |
| ● | Empowerment – We are empowered to be our best, individually and as a team. |
Our strategy is focused on growth and productivity including:
| ● | Growing our share of the U.S. housing market; |
| ● | Expanding our business in commercial and industrial construction; |
| ● | Acquiring strategically aligned businesses; |
| ● | Driving operational efficiencies throughout the business. |
Our operating results depend heavily on residential new construction activity and, to a lesser extent, on commercial construction and industrial construction, all of which are cyclical. We are also dependent on third-party suppliers and manufacturers providing us with an adequate supply of high-quality products.
26
COVID-19 Business Update
We continue to monitor the COVID-19 pandemic and its impact on macroeconomic and local economic conditions. While we are currently able to operate in all of our locations, there is no guarantee that the services we provide will continue to be allowed or that other events making the provision of our services challenging or impossible, will not occur. For example, if there are surges in levels of COVID-19 infections in certain states, those states may respond by, among other things, deeming residential, commercial, and industrial construction as nonessential in connection with a restriction of commercial activity.
We have implemented and continue to implement procedures and processes as required or recommended by governmental and medical authorities to ensure the safety of our employees, including increasing our cleaning and sanitizing practices at all locations and for all company vehicles, mandating social distancing on job sites and within our branch operations and limiting all but essential travel. However, we are not able to predict whether our customers will continue to operate at their current or typical volumes, and such decreases in their operations would have a negative impact on our business. We are also unable to predict how long the COVID-19 pandemic will last and the impact of the pandemic on demand for our products and services. For additional discussion of the potential impact of the COVID-19 pandemic on our business, see the sections entitled “Outlook” and “Risk Factors” included in this Annual Report.
Material Trends in Our Business
We remain optimistic about the U.S. housing market. Following a brief slowdown in the market during the 2nd quarter of 2020 due to the impacts from COVID-19, housing starts increased through much of 2020 and 2021, and ended the year at 1.7 million (based on seasonally-adjusted figures from the U.S. Census Bureau), the highest level of annual starts in more than a decade. However, housing completions have not been able to keep up with housing starts due to a variety of material and labor constraints across the entire housing construction industry. This environment of strong demand and tight supply has created significant inflation in the majority of the products we sell. We anticipate that the current environment of strong demand and tight supply will continue into 2022.
The commercial and industrial construction markets are also dealing with strong demand and tight supply. In addition, we have seen a number of projects pushed out or delayed. Our order volume and backlog for this work remains strong and we anticipate growth in this market in 2022.
Seasonality
Sales across all of our end markets are typically slower during the winter months due to lower construction activity. Historically, the installation of insulation lags housing starts by several months. However, the normal lag on residential housing starts has extended recently as demand for residential housing has surged, causing building materials and labor to be constrained. These material and labor constraints, as well as additional safety precautions related to COVID-19, have also extended the build cycle related to commercial construction.
Results of Operations
We report our financial results in conformity with GAAP.
27
The following table sets forth our net sales, gross profit, operating profit, and margins, as reported in our Consolidated Statements of Operations, in thousands:
Year Ended December 31, | |||||||
| 2021 |
| 2020 |
| |||
Net sales | $ | 3,486,207 | $ | 2,718,038 | |||
Cost of sales | 2,511,818 | 1,971,677 | |||||
Cost of sales ratio | 72.1 | % | 72.5 | % | |||
Gross profit | 974,389 | 746,361 | |||||
Gross profit margin | 27.9 | % | 27.5 | % | |||
Selling, general, and administrative expense | 497,970 | 391,315 | |||||
Selling, general, and administrative expense to sales ratio | 14.3 | % | 14.4 | % | |||
Operating profit | 476,419 | 355,046 | |||||
Operating profit margin | 13.7 | % | 13.1 | % | |||
Other expense, net | (42,976) | (31,956) | |||||
Income tax expense | (109,427) | (76,067) | |||||
Net income | $ | 324,016 | $ | 247,023 | |||
Net margin | 9.3 | % | 9.1 | % | |||
Comparison of the Years Ended December 31, 2021 and December 31, 2020
Sales and Operations
Net sales for 2021 increased 28.3 percent, or $768.2 million, to $3.5 billion. The increase was driven by a 15.6 percent increase in sales from acquisitions, 8.5 percent impact from higher selling prices, and a 4.1 percent increase in sales volume.
Our gross profit margins were 27.9 percent and 27.5 percent for 2021 and 2020, respectively. Gross profit margin improved primarily due to higher selling prices and sales volume, and savings from cost reduction activities, partially offset by an increase in cost of material and the amortization of inventory step-up related to purchase accounting.
Selling, general, and administrative expenses as a percentage of sales were 14.3 percent and 14.4 percent for 2021 and 2020, respectively. Decreased selling, general, and administrative expense as a percent of sales was primarily the result of higher sales and lower legal fees and share-based compensation expense partially offset by higher spend on acquisition-related costs such as intangible amortization and one-time transaction costs.
Operating margins were 13.7 percent and 13.1 percent for 2021 and 2020, respectively. The increase in operating margins related to higher selling prices and sales volume, savings from cost reduction activities, lower legal fees and share-based compensation expense, partially offset by an increase in cost of material, the amortization of inventory step-up related to purchase accounting and other one-time transaction costs.
Other Expense, Net
Other expense, net, which primarily consists of interest expense, increased $11.0 million to $43.0 million in 2021 compared with 2020. The increase is primarily related to costs incurred to redeem our 5.625% Senior Notes in 2021 and increased average debt outstanding in 2021, partially offset by lower interest rates on our 3.625% Senior Notes and borrowings under the Credit Agreement.
Income Tax Expense
Our effective tax rate increased from 23.5 percent in 2020 to 25.2 percent in 2021. The higher 2021 rate was primarily related to a decrease in the benefit related to share-based compensation and an increase in non-deductible items.
28
2021 and 2020 Business Segment Results
The following table sets forth our net sales and operating profit information by business segment, in thousands:
Year Ended December 31, | ||||||||
| 2021 |
| 2020 |
| Percent Change | |||
Net sales by business segment: | ||||||||
Installation | $ | 2,378,401 | $ | 1,943,461 | 22.4 | % | ||
Specialty Distribution | 1,287,176 | 926,207 | 39.0 | % | ||||
Intercompany eliminations | (179,370) | (151,630) | ||||||
Net sales | $ | 3,486,207 | $ | 2,718,038 | 28.3 | % | ||
Operating profit by business segment (a): | ||||||||
Installation | $ | 383,722 | $ | 294,793 | 30.2 | % | ||
Specialty Distribution | 169,368 | 115,343 | 46.8 | % | ||||
Intercompany eliminations | (29,653) | (24,305) | ||||||
Operating profit before general corporate expense | 523,437 | 385,831 | 35.7 | % | ||||
General corporate expense, net (b) | (47,018) | (30,785) | ||||||
Operating profit | $ | 476,419 | $ | 355,046 | 34.2 | % | ||
Operating profit margins: | ||||||||
Installation | 16.1 | % | 15.2 | % | ||||
Specialty Distribution | 13.2 | % | 12.5 | % | ||||
Operating profit margin before general corporate expense | 15.0 | % | 14.2 | % | ||||
Operating profit margin | 13.7 | % | 13.1 | % | ||||
| (a) | Segment operating profit for years ended December 31, 2021 and 2020 includes an allocation of general corporate expenses attributable to the operating segments which is based on direct benefit or usage (such as salaries of corporate employees who directly support the segment). |
| (b) | General corporate expense, net includes expenses not specifically attributable to our segments for functions such as corporate human resources, finance and legal, including salaries, benefits, and other related costs. |
2021 and 2020 Business Segment Results Discussion
Changes in operating profit margins in the following business segment results discussion exclude general corporate expense, net in 2021 and 2020, as applicable.
Installation
Sales
Sales increased $434.9 million, or 22.4 percent, in 2021 compared to 2020. Sales increased 11.4 percent from acquisitions, 6.5 percent due to higher selling prices and 4.5 percent sales volume.
Operating Results
Operating margins in the Installation segment were 16.1 percent and 15.2 percent for 2021 and 2020, respectively. The increase in operating margin was driven by higher sales volume and selling prices, savings from cost reduction activities, and lower legal fees, partially offset by an increase in cost of material.
Specialty Distribution
Sales
Sales increased $361.0 million, or 39.0 percent, in 2021 compared to 2020. Sales increased 22.0 percent from acquisitions, 13.7 percent due to higher selling prices and 3.3 percent sales volume.
29
Operating Results
Operating margins in the Specialty Distribution segment were 13.2 percent and 12.5 percent for 2021 and 2020, respectively. The increase in operating margin was driven by higher sales volume and selling prices and savings from cost reduction activities, partially offset by an increase in cost of material and the amortization of inventory step-up related to purchase accounting.
Commitments and Contingencies
We are subject to certain claims, charges, litigation, and other proceedings in the ordinary course of our business. We believe we have adequate defenses in these matters, and we do not believe that the ultimate outcome of these matters will have a material adverse effect on us. For additional information see Item 8. Financial Statements and Supplementary Data – Note 11. Other Commitments and Contingencies.
Liquidity and Capital Resources
We have access to liquidity through our cash from operations and available borrowing capacity under our Credit Agreement, which provides for borrowing and/or standby letter of credit issuances of up to $500 million under the revolving facility. For additional information regarding our outstanding debt and borrowing capacity see Item 8. Financial Statements and Supplementary Data – Note 6. Long-Term Debt.
The following table summarizes our total liquidity, in thousands:
As of | ||||||
December 31, | December 31, | |||||
| 2021 |
| 2020 | |||
Cash and cash equivalents (a) | $ | 139,779 | $ | 330,007 | ||
Revolving facility | 500,000 | 450,000 | ||||
Less: standby letters of credit | (69,936) | (60,382) | ||||
Availability under revolving facility | 430,064 | 389,618 | ||||
Total liquidity | $ | 569,843 | $ | 719,625 | ||
| (a) | Our cash and cash equivalents consist of AAA-rated money market funds as well as cash held in our demand deposit accounts. |
We believe that our cash flows from operations, combined with our current cash levels and available borrowing capacity, will be adequate to support our ongoing operations and to fund our debt service requirements, capital expenditures and working capital needs for at least the next twelve months. We also have adequate liquidity to maintain off-balance sheet arrangements for short-term leases, letters of credit, and performance and license bonds. See Item 8. Financial Statements and Supplementary Data of this Annual Report for related disclosures.
Our material cash requirements from known contractual and other obligations primarily relate to our debt and lease obligations. Expected timing of those payments are as follows as of December 31, 2021, in thousands:
Payments Due by Period | |||||||||||||||||||||
2022 | 2023 | 2024 | 2025 | 2026 | Thereafter | Total | |||||||||||||||
Operating leases (a) |
| $ | 59,414 | $ | 46,076 |
| $ | 35,388 |
| $ | 25,726 |
| $ | 15,175 |
| $ | 10,593 |
| $ | 192,372 | |
Finance leases (b) | 2,641 | 2,419 | 1,663 | 1,524 | 1,064 | 1,608 | 10,919 | ||||||||||||||
Principal repayments of long-term debt (c) | 38,639 | 40,075 | 47,121 | 48,750 | 438,750 | 900,000 | 1,513,335 | ||||||||||||||
Interest payments and fees on long-term debt (d) | 46,823 | 49,526 | 52,417 | 53,756 | 53,869 | 147,881 | 404,272 | ||||||||||||||
Total | $ | 147,517 | $ | 138,096 | $ | 136,589 | $ | 129,756 | $ | 508,858 | $ | 1,060,082 | $ | 2,120,898 | |||||||
30
(a) We lease certain locations, vehicles and equipment under operating lease agreements. In some instances, these lease agreements exist with related parties. For additional information, see Note 2 – Leases to our audited consolidated financial statements included in this Form 10-K.
(b) We lease certain fleet vehicles and equipment under a finance lease structure. Finance lease obligations, as disclosed above, include estimated interest expense payments using our incremental borrowing rates effective at December 31, 2021.
(c) Principal repayments of long-term debt include payments under our term loan facility, equipment notes, 3.625% Senior Notes and 4.125% Senior Notes. No borrowings are assumed under our revolving facility in the schedule above. For additional information, see Note 6 – Long-Term Debt to our audited consolidated financial statements included in this Form 10-K.
(d) Interest and fees have been calculated using the interest rate on our long-term debt as of December 31, 2021 and assumes our standby letters of credit remain constant during the term of our Credit Agreement.
Cash Flows
The following table presents a summary of our cash flows provided by (used in) operating, investing and financing activities for the periods indicated, in thousands:
Year Ended December 31, | ||||||
| 2021 |
| 2020 | |||
Changes in cash and cash equivalents: | ||||||
Net cash provided by operating activities | $ | 403,025 | $ | 357,884 | ||
Net cash used in investing activities |
| (1,322,245) |
| (121,883) | ||
Net cash provided by (used in) financing activities | 729,007 |
| (90,801) | |||
Impact of foreign currency on cash | (15) | — | ||||
Net (decrease) increase in cash and cash equivalents | $ | (190,228) | $ | 145,200 | ||
Net cash flows provided by operating activities increased $45.1 million for the year ended December 31, 2021, as compared to December 31, 2020. The increase was primarily due to an increase in net income partially offset by the impact of higher working capital seen in Accounts Receivable, Inventory, and Accounts Payable.
Net cash used in investing activities was $1,322.2 million for the year ended December 31, 2021, primarily comprised of $1,267.1 million for acquisitions and $55.5 million for purchases of property and equipment, primarily vehicles. Net cash used in investing activities was $121.9 million for the year ended December 31, 2020, primarily comprised of $83.4 million for acquisitions and $40.9 million for purchases of property and equipment, primarily vehicles, partially offset by $2.5 million of proceeds from the sale of property and equipment.
Net cash provided by financing activities was $729.0 million for the year ended December 31, 2021. Cash increased by $1,218.8 million from proceeds received on Amendment No. 1 to Credit Agreement in the first quarter of 2021 and again in the fourth quarter of 2021 as well as the 4.125% Senior Notes issuance in the fourth quarter of 2021, used to fund the acquisition of DI. These increases were partially offset by repayments of $433.1 million including $400.0 million to redeem our 5.625% Senior Notes and payments on our term loan and equipment notes as well as $15.0 million used for debt issuance costs related to Amendment No. 1 to Credit Agreement in the first quarter of 2021 and again in the fourth quarter of 2021 as well as the 4.125% Senior Notes issuance in the fourth quarter of 2021. Additionally, we used $35.6 million for the repurchase of common stock pursuant to the 2019 Repurchase Program, as well as $5.5 million net activity related to exercise of share-based incentive awards and stock options. Net cash used in financing activities was $90.8 million for the year ended December 31, 2020. We used $49.2 million for the repurchase of common stock pursuant to the 2019 Repurchase Program, $24.9 million for payments on our term loan under our Credit Agreement and on our equipment notes, $14.9 million for purchases of common stock for tax withholding obligations related to the vesting and exercise of share-based incentive awards, and $2.3 million in debt issuance costs as a result of entering into a new term loan and revolving credit facility.
31
Critical Accounting Policies and Estimates
We prepare our Consolidated Financial Statements in conformity with GAAP. The preparation of these financial statements requires us to make estimates and assumptions that affect the reported amounts and disclosure of assets and liabilities, and any related contingencies, at the date of the financial statements, as well as the reported amounts of sales and expenses during the reporting period. Actual results could differ from those estimates.
Our significant accounting policies are more fully described in Item 8. Financial Statements and Supplementary Data – Note 1. Summary of Significant Accounting Policies. However, certain of our accounting policies considered critical are those we believe are both most important to the portrayal of our financial condition and operating results and require our most difficult, subjective, or complex judgments, often as a result of the need to make estimates about the effect of matters that are inherently uncertain. Judgments and uncertainties affecting the application of those policies may result in materially different amounts being reported under different conditions or using different assumptions. We consider the following policies to be most critical in understanding the judgments that are involved in preparing our Consolidated Financial Statements.
Revenue Recognition and Receivables
We recognize revenue for our Installation segment over time as the related performance obligation is satisfied with respect to each particular order within a given customer’s contract. Progress toward complete satisfaction of the performance obligation is measured using a cost-to-cost measure of progress method. The cost input is based on the amount of material installed at that customer’s location and the associated labor costs, as compared to the total expected cost for the particular order. The total expected cost is a significant estimate in the revenue recognition process, requires judgment, and is subject to variability throughout the duration of the contract as a result of contract modifications and other circumstances impacting job completion. Generally, this results in revenue being recognized as the customer is able to receive and utilize the benefits provided by our services. Each contract contains one or more individual orders, which are based on services delivered. When material and installation services are bundled in a contract, we combine these items into one performance obligation as the overall promise is to transfer the combined item.
Revenue from our Specialty Distribution segment is recognized when title to products and risk of loss transfers to our customers. This represents the point in time when the customer is able to direct the use of and obtain substantially all the benefits from the product. The determination of when control is deemed transferred depends on the shipping terms that are agreed upon in the contract.
At time of sale, we record estimated reductions to revenue for customer programs and incentive offerings, including special pricing and other volume-based incentives based on historical experience, which is continuously adjusted. The duration of our contracts with customers is relatively short, generally less than a 90-day period, and therefore there is not a significant financing component when considering the determination of the transaction price which gets allocated to the individual performance obligations, generally based on standalone selling prices. Additionally, we consider shipping costs charged to a customer as a fulfillment cost rather than a promised service and expense as incurred. Sales taxes, when incurred, are recorded as a liability and excluded from revenue on a net basis.
We record a contract asset when we have satisfied our performance obligation prior to billing and a contract liability when a customer payment is received prior to the satisfaction of our performance obligation. The difference between the beginning and ending balances of our contract assets and liabilities primarily results from the timing of our performance and the customer’s payment.
We maintain allowances for estimated losses resulting from the inability of customers to make required payments. In addition, we monitor our customer receivable balances and the credit worthiness of our customers on an on-going basis. During downturns in our markets, declines in the financial condition and creditworthiness of customers impact the credit risk of the receivables involved and we have incurred additional bad debt expense related to customer defaults.
32
Business Combinations
The purchase price for business combinations is allocated to the estimated fair values of acquired tangible and intangible assets, including goodwill, and assumed liabilities, where applicable. Additionally, we recognize customer relationships, trademarks and trade names, and non-compete agreements as identifiable intangible assets, which are recorded at fair value as of the transaction date. The fair value of the customer relationships intangible assets was determined by management using the multi-period excess earnings method under the income approach. Assumptions used in determining the fair value of the customer relationships intangible asset included forecasted revenue growth rate, customer attrition rate, and discount rate. The fair value of other intangible assets is determined primarily using current industry information. Goodwill is recorded when consideration transferred exceeds the fair value of identifiable assets and liabilities. Measurement-period adjustments to assets acquired and liabilities assumed with a corresponding offset to goodwill are recorded in the period they occur, which may include up to one year from the acquisition date. Contingent consideration is recorded at fair value at the acquisition date.
Goodwill and Other Intangible Assets
We have two reporting units, which are also our operating and reporting segments: Installation and Specialty Distribution, and both contain goodwill. Our operating segments engage in business activities for which discrete financial information including long range forecasts is available, and we complete the impairment testing of goodwill at this level, as defined by accounting guidance. Assets acquired and liabilities assumed are assigned to the applicable reporting unit based on whether the acquired assets and liabilities relate to the operations of such unit and determination of its fair value. Goodwill assigned to the reporting unit is the excess of the fair value of the acquired business over the fair value of the individual assets acquired and liabilities assumed for the reporting unit.
We perform our annual impairment testing of goodwill in the fourth quarter of each year, or as events occur or circumstances change that would more likely than not reduce the fair value of a reporting unit below its carrying amount. When assessing goodwill for impairment, we have the option to first assess qualitative factors to determine whether the existence of events or circumstances leads to a determination that it is more likely than not that the fair value of a reporting unit is less than its carrying amount. If, after assessing the totality of events or circumstances, we determine it is more likely than not that the fair value of a reporting unit is less than its carrying amount, then we recognize an impairment charge for the amount by which the carrying amount exceeds the reporting unit’s fair value. If we conclude otherwise, then no further action is taken. We also have the option to bypass the qualitative assessment and only perform a quantitative assessment. For the year ended December 31, 2021, we performed a qualitative assessment.
Fair value for our reporting units is determined using a discounted cash flow method which includes significant unobservable inputs (Level 3 inputs). We believe this methodology is comparable to what would be used by other market participants. Using the discounted cash flow method requires us to make significant estimates and assumptions, including long term projections of cash flows, market conditions, and appropriate discount rates. Our judgments are based on historical experience, current market trends, consultations with external valuation specialists and other information. While we believe that the estimates and assumptions underlying the valuation methodology are reasonable, changes to estimates and assumptions could result in different outcomes. In estimating future cash flows, we rely on internally generated long-range forecasts for sales and operating profits, and generally a one to three percent long term assumed annual growth rate of cash flows for periods after the long-range forecast. We generally develop these forecasts based upon, among other things, recent sales data for existing products, and estimated U.S. housing starts.
When necessary, an impairment loss is recognized to the extent that a reporting unit’s recorded goodwill exceeds its fair value. In the fourth quarters of 2021 and 2020, we performed an assessment on our goodwill and determined that the estimated fair value of each reporting unit substantially exceeded its carrying value at December 31, 2021, and therefore the goodwill was not impaired.
33
We did not recognize any impairment charges for goodwill for the years ended December 31, 2021, 2020, and 2019. As of December 31, 2021, net goodwill reflected $762.0 million of accumulated impairment losses, relating primarily to impairment charges taken in 2008-2010 following the substantial decrease in U.S. housing starts after the financial crisis of 2007-2008.
Intangible assets with finite useful lives are amortized using the straight-line method over their estimated useful lives. We evaluate the remaining useful lives of amortizable identifiable intangible assets at each reporting period to determine whether events and circumstances warrant a revision to the remaining periods of amortization.
Income Taxes
If, based upon all available evidence, both positive and negative, it is more likely than not (more than 50 percent likely) deferred tax assets will not be realized, a valuation allowance is recorded. Significant weight is given to positive and negative evidence that is objectively verifiable. A company’s three year cumulative loss position is significant negative evidence in considering whether deferred tax assets are realizable and the accounting guidance restricts the amount of reliance we can place on projected taxable income to support the recovery of deferred tax assets.
Current accounting guidance allows the recognition of only those income tax positions that have a greater than 50 percent likelihood of being sustained upon examination by taxing authorities. We believe that there is an increased potential for volatility in our effective tax rate because this threshold allows changes in the income tax environment and the inherent complexities of income tax law in a substantial number of jurisdictions to affect the computation of the liability for uncertain tax positions to a greater extent.
While we believe we have adequately assessed for our uncertain tax positions, amounts asserted by taxing authorities could vary from our assessment of uncertain tax positions. Accordingly, provisions for tax-related matters, including interest and penalties, could be recorded in income tax expense in the period revised assessments are made.
Recently Issued Accounting Pronouncements
Recently issued accounting pronouncements and their expected or actual effect on our reported results of operations are addressed in Item 8. Financial Statements and Supplementary Data – Note 1. Summary of Significant Accounting Policies.
Item 7A. QUANTITATIVE AND QUALITATIVE DISCLOSURES ABOUT MARKET RISK
Interest Rate Risk
On October 7, 2021, the Company entered into Amendment No. 2 to Credit Agreement. Amendment No. 2 to Credit Agreement provides for a term loan facility in an aggregate principal amount of $600.0 million, comprised of a $300.0 term loan facility and $300.0 million delayed draw term loan commitment, all of which was drawn on October 7, 2021 and a revolving facility with an aggregate borrowing capacity of $500.0 million. We also have outstanding 3.625% Senior Notes with an aggregate principal balance of $400.0 million and 4.125% Senior Notes with an aggregate principal balance of $500.0 million. The 3.625% Senior Notes and 4.125% Senior Notes bear a fixed rate of interest and therefore are excluded from the calculation below as they are not subject to fluctuations in interest rates.
Interest payable on both the aggregate term loan facility and revolving facility under Amendment No. 2 to Credit Agreement is based on a variable interest rate. As a result, we are exposed to market risks related to fluctuations in interest rates on this outstanding indebtedness. As of December 31, 2021, we had $596.3 million outstanding under our term loan facility, and the applicable interest rate as of such date was 1.09%. Based on our outstanding borrowings under Amendment No. 2 to Credit Agreement as of December 31, 2021, a 100 basis point increase in the interest rate would result in a $5.9 million increase in our annualized interest expense. There was no outstanding balance under the revolving facility as of December 31, 2021.
34
Item 8. FINANCIAL STATEMENTS AND SUPPLEMENTARY DATA
Report of Independent Registered Public Accounting Firm
To the Board of Directors and Stockholders of TopBuild Corp.
Opinions on the Financial Statements and Internal Control over Financial Reporting
We have audited the accompanying consolidated balance sheets of TopBuild Corp. and its subsidiaries (the “Company”) as of December 31, 2021 and 2020, and the related consolidated statements of operations, of changes in equity and of cash flows for each of the three years in the period ended December 31, 2021, including the related notes (collectively referred to as the “consolidated financial statements”). We also have audited the Company's internal control over financial reporting as of December 31, 2021, based on criteria established in Internal Control - Integrated Framework (2013) issued by the Committee of Sponsoring Organizations of the Treadway Commission (COSO).
In our opinion, the consolidated financial statements referred to above present fairly, in all material respects, the financial position of the Company as of December 31, 2021 and 2020, and the results of its operations and its cash flows for each of the three years in the period ended December 31, 2021 in conformity with accounting principles generally accepted in the United States of America. Also in our opinion, the Company maintained, in all material respects, effective internal control over financial reporting as of December 31, 2021, based on criteria established in Internal Control - Integrated Framework (2013) issued by the COSO.
Basis for Opinions
The Company's management is responsible for these consolidated financial statements, for maintaining effective internal control over financial reporting, and for its assessment of the effectiveness of internal control over financial reporting, included in Management's Report on Internal Control over Financial Reporting appearing under Item 9A. Our responsibility is to express opinions on the Company’s consolidated financial statements and on the Company's internal control over financial reporting based on our audits. We are a public accounting firm registered with the Public Company Accounting Oversight Board (United States) (PCAOB) and are required to be independent with respect to the Company in accordance with the U.S. federal securities laws and the applicable rules and regulations of the Securities and Exchange Commission and the PCAOB.
We conducted our audits in accordance with the standards of the PCAOB. Those standards require that we plan and perform the audits to obtain reasonable assurance about whether the consolidated financial statements are free of material misstatement, whether due to error or fraud, and whether effective internal control over financial reporting was maintained in all material respects.
Our audits of the consolidated financial statements included performing procedures to assess the risks of material misstatement of the consolidated financial statements, whether due to error or fraud, and performing procedures that respond to those risks. Such procedures included examining, on a test basis, evidence regarding the amounts and disclosures in the consolidated financial statements. Our audits also included evaluating the accounting principles used and significant estimates made by management, as well as evaluating the overall presentation of the consolidated financial statements. Our audit of internal control over financial reporting included obtaining an understanding of internal control over financial reporting, assessing the risk that a material weakness exists, and testing and evaluating the design and operating effectiveness of internal control based on the assessed risk. Our audits also included performing such other procedures as we considered necessary in the circumstances. We believe that our audits provide a reasonable basis for our opinions.
As described in Management’s Report on Internal Control over Financial Reporting, management has excluded Distribution International from its assessment of internal control over financial reporting as of December 31, 2021 because it was acquired by the Company in a purchase business combination during 2021. We have also excluded Distribution International from our audit of internal control over financial reporting. Distribution International is a wholly-owned subsidiary whose total assets and total revenues excluded from management’s assessment and our audit of internal control over financial reporting represent 9% and 5%, respectively, of the related consolidated financial statement amounts as of and for the year ended December 31, 2021.
35
Definition and Limitations of Internal Control over Financial Reporting
A company’s internal control over financial reporting is a process designed to provide reasonable assurance regarding the reliability of financial reporting and the preparation of financial statements for external purposes in accordance with generally accepted accounting principles. A company’s internal control over financial reporting includes those policies and procedures that (i) pertain to the maintenance of records that, in reasonable detail, accurately and fairly reflect the transactions and dispositions of the assets of the company; (ii) provide reasonable assurance that transactions are recorded as necessary to permit preparation of financial statements in accordance with generally accepted accounting principles, and that receipts and expenditures of the company are being made only in accordance with authorizations of management and directors of the company; and (iii) provide reasonable assurance regarding prevention or timely detection of unauthorized acquisition, use, or disposition of the company’s assets that could have a material effect on the financial statements.
Because of its inherent limitations, internal control over financial reporting may not prevent or detect misstatements. Also, projections of any evaluation of effectiveness to future periods are subject to the risk that controls may become inadequate because of changes in conditions, or that the degree of compliance with the policies or procedures may deteriorate.
Critical Audit Matters
The critical audit matters communicated below are matters arising from the current period audit of the consolidated financial statements that were communicated or required to be communicated to the audit committee and that (i) relate to accounts or disclosures that are material to the consolidated financial statements and (ii) involved our especially challenging, subjective, or complex judgments. The communication of critical audit matters does not alter in any way our opinion on the consolidated financial statements, taken as a whole, and we are not, by communicating the critical audit matters below, providing separate opinions on the critical audit matters or on the accounts or disclosures to which they relate.
Revenue Recognition – Total Expected Costs for Performance Obligations Satisfied Over Time
As described in Notes 1 and 3 to the consolidated financial statements, $2,378 million of the Company’s total revenues for the year ended December 31, 2021 was generated from the Installation segment. Revenue is recognized for the Installation segment over time as the related performance obligation is satisfied with respect to each particular order within a given customer’s contract. Progress toward complete satisfaction of the performance obligation is measured using a cost-to-cost measure of progress method. The cost input is based on the amount of material installed at that customer’s location and the associated labor costs, as compared to the total expected cost for the particular order. The total expected cost is a significant estimate in the revenue recognition process, requires judgment, and is subject to variability throughout the duration of the contract as a result of contract modifications and other circumstances impacting job completion. Revenue is recognized over time as the customer is able to receive and utilize the benefits provided.
The principal considerations for our determination that performing procedures relating to revenue recognition – total expected costs for performance obligations satisfied over time is a critical audit matter are (i) the significant judgment by management when determining the total expected costs for a customer contract and (ii) a high degree of auditor judgment and effort in performing procedures and evaluating management’s significant assumptions related to the estimated amount of material installed and the associated labor costs.
Addressing the matter involved performing procedures and evaluating audit evidence in connection with forming our overall opinion on the consolidated financial statements. These procedures included testing the effectiveness of controls relating to the revenue recognition process, including controls over the estimation of total expected costs for performance obligations satisfied over time. The procedures also included, among others (i) testing management’s process for determining the total expected costs for a sample of customer contracts and (ii) evaluating the reasonableness of significant assumptions related to the estimated amount of material to be installed and the associated
36
labor costs used by management and considering the factors that can affect the accuracy of those estimates. Evaluating the reasonableness of significant assumptions used involved assessing management’s ability to reasonably estimate total expected costs for customer contracts by (i) performing a comparison of the originally estimated and actual costs incurred on completed contracts and (ii) evaluating the timely identification of circumstances that may warrant a modification to total expected cost, including actual costs in excess of estimates.
Valuation of the customer relationships intangible asset - Acquisition of Distribution International
As described in Notes 1 and 15 to the consolidated financial statements, on October 15, 2021, the Company acquired Distribution International for $1,031 million in cash, which resulted in recording of a customer relationships intangible asset valued at $434 million. The fair value for the customer relationships intangible asset was determined by management using the multi-period excess earnings method under the income approach. Assumptions used in determining the fair value of the customer relationships intangible asset included forecasted revenue growth rate, customer attrition rate, and discount rate.
The principal considerations for our determination that performing procedures relating to the valuation of the customer relationships intangible asset from the Distribution International acquisition is a critical audit matter are (i) a high degree of auditor judgment and subjectivity in performing procedures relating to the fair value of the customer relationships intangible asset due to the significant judgment by management when developing the estimate; (ii) the significant audit effort in evaluating the significant assumptions related to forecasted revenue growth rate, customer attrition rate, and discount rate; and (iii) the audit effort involved the use of professionals with specialized skill and knowledge.
Addressing the matter involved performing procedures and evaluating audit evidence in connection with forming our overall opinion on the consolidated financial statements. These procedures included testing the effectiveness of controls relating to the acquisition accounting, including controls over management’s valuation of the customer relationships intangible asset and controls over the development of significant assumptions related to forecasted revenue growth rate, customer attrition rate, and discount rate. These procedures also included, among others (i) reading the purchase agreement; (ii) testing management’s process for estimating the fair value of the customer relationships intangible asset; (iii) evaluating the appropriateness of the multi-period excess earnings method; (iv) testing the completeness and accuracy of the underlying data provided by management; and (v) evaluating the reasonableness of the significant assumptions used by management related to forecasted revenue growth rate, customer attrition rate, and discount rate. Evaluating management’s assumptions related to forecasted revenue growth rate and customer attrition rate involved evaluating whether the assumptions were reasonable considering (i) the current and past performance of Distribution International; (ii) consistency with external market and industry data; and (iii) whether these assumptions were consistent with evidence obtained in other areas of the audit. Professionals with specialized skill and knowledge were used to assist in evaluating the appropriateness of the multi-period excess earnings method and the discount rate assumption.
/s/
February 22, 2022
We have served as the Company’s auditor since 2015.
37
TOPBUILD CORP.
CONSOLIDATED BALANCE SHEETS
(In thousands except share amounts)
As of | ||||||
| December 31, | December 31, | ||||
2021 | 2020 | |||||
ASSETS | ||||||
Current assets: | ||||||
Cash and cash equivalents | $ | | $ | | ||
Receivables, net of an allowance for credit losses of $ | |
| | |||
Inventories, net | |
| | |||
Prepaid expenses and other current assets | |
| | |||
Total current assets | |
| | |||
Right of use assets | | | ||||
Property and equipment, net | |
| | |||
Goodwill | |
| | |||
Other intangible assets, net | |
| | |||
Deferred tax assets, net | | | ||||
Other assets | |
| | |||
Total assets | $ | | $ | | ||
LIABILITIES AND EQUITY | ||||||
Current liabilities: | ||||||
Accounts payable | $ | | $ | | ||
Current portion of long-term debt | | | ||||
Accrued liabilities | | | ||||
Short-term operating lease liabilities | | | ||||
Short-term finance lease liabilities | | — | ||||
Total current liabilities | | | ||||
Long-term debt | | | ||||
Deferred tax liabilities, net | | | ||||
Long-term portion of insurance reserves | | | ||||
Long-term operating lease liabilities | | | ||||
Long-term finance lease liabilities | | — | ||||
Other liabilities | | |||||
Total liabilities | | | ||||
Commitments and contingencies | ||||||
Equity: | ||||||
Preferred stock, $ | ||||||
Common stock, $ | | | ||||
Treasury stock, | ( | ( | ||||
Additional paid-in capital | | | ||||
Retained earnings | | | ||||
Accumulated other comprehensive loss | ( | — | ||||
Total equity | | | ||||
Total liabilities and equity | $ | | $ | | ||
See notes to our consolidated financial statements.
38
TOPBUILD CORP.
CONSOLIDATED STATEMENTS OF OPERATIONS
(In thousands except share and per common share amounts)
Year Ended December 31, | |||||||||
2021 | 2020 | 2019 | |||||||
Net sales | $ | |
| $ | |
| $ | | |
Cost of sales | | | | ||||||
Gross profit | | | | ||||||
Selling, general, and administrative expense | | | | ||||||
Operating profit | | | | ||||||
Other income (expense), net: | |||||||||
Interest expense | ( | ( | ( | ||||||
Loss on extinguishment of debt | ( | ( | — | ||||||
Other, net | | | | ||||||
Other income, net | ( | ( | ( | ||||||
Income before income taxes | | | | ||||||
Income tax expense | ( | ( | ( | ||||||
Net income | $ | | $ | | $ | | |||
Net income per common share: | |||||||||
Basic | $ | | $ | $ | | ||||
Diluted | $ | | $ | | $ | | |||
Weighted average shares outstanding: | |||||||||
Basic | | | | ||||||
Diluted | | | | ||||||
See notes to our consolidated financial statements.
39
TOPBUILD CORP.
CONSOLIDATED STATEMENTS OF COMPREHENSIVE INCOME
(In thousands)
Year Ended December 31, | |||||||||
2021 | 2020 | 2019 | |||||||
Net income | $ | | $ | | $ | | |||
Other comprehensive income (loss): | |||||||||
Foreign currency translation adjustment | ( | — | — | ||||||
Comprehensive income | $ | | $ | | $ | | |||
See notes to our consolidated financial statements.
40
TOPBUILD CORP.
CONSOLIDATED STATEMENTS OF CASH FLOWS
(In thousands)
Year Ended December 31, | |||||||||
2021 | 2020 | 2019 | |||||||
Cash Flows Provided by (Used in) Operating Activities: |
|
|
|
|
| ||||
Net income | $ | | $ | | $ | | |||
Adjustments to reconcile net income to net cash provided by operating activities: | |||||||||
Depreciation and amortization | | | | ||||||
Share-based compensation | | | | ||||||
Loss on extinguishment of debt | | | — | ||||||
Loss (gain) on sale or abandonment of property and equipment | | ( | | ||||||
Amortization of debt issuance costs | | | | ||||||
Provision for bad debt expense | | | | ||||||
Loss from inventory obsolescence | | | | ||||||
Loss on foreign exchange | | — | — | ||||||
Deferred income taxes, net | ( | ( | | ||||||
Change in certain assets and liabilities | |||||||||
Receivables, net | ( | | ( | ||||||
Inventories, net | ( | ( | | ||||||
Prepaid expenses and other current assets | | ( | | ||||||
Accounts payable | | | ( | ||||||
Accrued liabilities | | | ( | ||||||
Payment of contingent consideration | ( | ( | — | ||||||
Other, net | ( | | | ||||||
Net cash provided by operating activities | | | | ||||||
Cash Flows Provided by (Used in) Investing Activities: | |||||||||
Purchases of property and equipment | ( | ( | ( | ||||||
Acquisition of businesses, net of cash acquired | ( | ( | ( | ||||||
Proceeds from sale of property and equipment | | | | ||||||
Other, net | — | — | | ||||||
Net cash used in investing activities | ( | ( | ( | ||||||
Cash Flows Provided by (Used in) Financing Activities: | |||||||||
Proceeds from issuance of long-term debt | | | | ||||||
Repayment of long-term debt | ( | ( | ( | ||||||
Payment of debt issuance costs | ( | ( | — | ||||||
Taxes withheld and paid on employees' equity awards | ( | ( | ( | ||||||
Exercise of stock options | | | — | ||||||
Repurchase of shares of common stock | ( | ( | ( | ||||||
Payment of contingent consideration | ( | ( | ( | ||||||
Net cash provided by (used in) financing activities | | ( | ( | ||||||
Impact of foreign currency on cash | ( | — | — | ||||||
Net (decrease) increase in cash and cash equivalents | ( | | | ||||||
Cash and cash equivalents- Beginning of period |
| |
| |
| | |||
Cash and cash equivalents- End of period | $ | | $ | | $ | | |||
Supplemental disclosure of cash paid for: | |||||||||
Interest | $ | | $ | | $ | | |||
Income taxes | | | | ||||||
Supplemental disclosure of noncash activities: | |||||||||
Leased assets obtained in exchange for new operating lease liabilities | $ | | $ | | $ | | |||
Leased assets obtained in exchange for new finance lease liabilities | | — | — | ||||||
Accruals for property and equipment | | | | ||||||
See notes to our consolidated financial statements.
41
TOPBUILD CORP.
CONSOLIDATED STATEMENTS OF CHANGES IN EQUITY
(In thousands, except share amounts)
Accumulated | |||||||||||||||||
Common | Treasury | Additional | Other | ||||||||||||||
Stock | Stock | Paid-in | Retained | Comprehensive | |||||||||||||
($ | at cost | Capital | Earnings | Income | Equity | ||||||||||||
Balance at December 31, 2018 | $ | | $ | ( | $ | | $ | | $ | — | $ | | |||||
Net income | — | — | — | | — | | |||||||||||
Share-based compensation | — | — | | — | — | | |||||||||||
Issuance of | | — | ( | — | — | — | |||||||||||
Repurchase of | — | ( | | — | — | — | |||||||||||
Repurchase of | — | ( | — | — | — | ( | |||||||||||
Repurchase of | — | ( | ( | — | — | ( | |||||||||||
— | — | ( | — | — | ( | ||||||||||||
Balance at December 31, 2019 | $ | | $ | ( | $ | | $ | | $ | — | $ | | |||||
Cumulative-effect of accounting change | — | — | — | ( | — | ( | |||||||||||
Net income | — | — | — | | — | | |||||||||||
Share-based compensation | — | — | | — | — | | |||||||||||
Issuance of | | — | ( | — | — | — | |||||||||||
Repurchase of | — | ( | — | — | — | ( | |||||||||||
Repurchase of | — | ( | | — | — | — | |||||||||||
— | — | ( | — | — | ( | ||||||||||||
— | — | | — | — | | ||||||||||||
Balance at December 31, 2020 | $ | | $ | ( | $ | | $ | | $ | — | $ | | |||||
Net income | — | — | — | | — | | |||||||||||
Share-based compensation | — | — | | — | — | | |||||||||||
Issuance of | | — | ( | — | — | — | |||||||||||
Repurchase of | — | ( | — | — | — | ( | |||||||||||
— | ( | — | — | — | ( | ||||||||||||
— | — | | — | — | | ||||||||||||
Other comprehensive loss, net of tax | — | — | — | — | ( | ( | |||||||||||
Balance at December 31, 2021 | $ | | $ | ( | $ | | $ | | $ | ( | $ | | |||||
See notes to our consolidated financial statements.
42
TOPBUILD CORP.
NOTES TO CONSOLIDATED FINANCIAL STATEMENTS
1. SUMMARY OF SIGNIFICANT ACCOUNTING POLICIES
Basis of Presentation. TopBuild is a Delaware corporation and trades on the NYSE under the symbol “BLD.” We report our business in
Financial Statement Presentation. The consolidated financial statements have been developed in conformity with GAAP. All significant intercompany transactions between the TopBuild entities have been eliminated.
Use of Estimates and Assumptions in the Preparation of Financial Statements. The preparation of our consolidated financial statements in conformity with GAAP requires us to make certain estimates and assumptions that affect the reported amounts of assets and liabilities, and disclosure of any contingent assets and liabilities, at the date of the financial statements, and the reported amounts of sales and expenses during the reporting period. Actual results may differ from these estimates and assumptions.
Revenue Recognition. Revenue is disaggregated between our Installation and Specialty Distribution segments. A reconciliation of disaggregated revenue by segment is included in Note 8 – Segment Information.
We recognize revenue for our Installation segment over time as the related performance obligation is satisfied with respect to each particular order within a given customer’s contract. Progress toward complete satisfaction of the performance obligation is measured using a cost-to-cost measure of progress method. The cost input is based on the amount of material installed at that customer’s location and the associated labor costs, as compared to the total expected cost for the particular order. The total expected cost is a significant estimate in the revenue recognition process, requires judgment, and is subject to variability throughout the duration of the contract as a result of contract modifications and other circumstances impacting job completion. Generally, this results in revenue being recognized as the customer is able to receive and utilize the benefits provided by our services. Each contract contains one or more individual orders, which are based on services delivered. When material and installation services are bundled in a contract, we combine these items into one performance obligation as the overall promise is to transfer the combined item.
Revenue from our Specialty Distribution segment is recognized when title to products and risk of loss transfers to our customers. This represents the point in time when the customer is able to direct the use of and obtain substantially all the benefits from the product. The determination of when control is deemed transferred depends on the shipping terms that are agreed upon in the contract.
At time of sale, we record estimated reductions to revenue for customer programs and incentive offerings, including special pricing and other volume-based incentives based on historical experience, which is continuously adjusted. The duration of our contracts with customers is relatively short, generally less than a 90-day period, therefore there is not a significant financing component when considering the determination of the transaction price which gets allocated to the individual performance obligations, generally based on standalone selling prices. Additionally, we consider shipping costs charged to a customer as a fulfillment cost rather than a promised service and expense as incurred. Sales taxes, when incurred, are recorded as a liability and excluded from revenue on a net basis.
We record a contract asset when we have satisfied our performance obligation prior to billing and a contract liability when a customer payment is received prior to the satisfaction of our performance obligation. The difference between the beginning and ending balances of our contract assets and liabilities primarily results from the timing of our performance and the customer’s payment. See Note 3 – Revenue Recognition for more information.
43
TOPBUILD CORP.
NOTES TO CONSOLIDATED FINANCIAL STATEMENTS
Business Combinations. The purchase price for business combinations is allocated to the estimated fair values of acquired tangible and intangible assets, including goodwill, and assumed liabilities, where applicable. Additionally, we recognize customer relationships, trademarks and trade names, and non-compete agreements as identifiable intangible assets, which are recorded at fair value as of the transaction date. The fair value of the customer relationships intangible assets were determined by management using the multi-period excess earnings method under the income approach. Assumptions used in determining the fair value of the customer relationships intangible asset included forecasted revenue growth rate, customer attrition rate, and discount rate. The fair value of other intangible assets is determined primarily using current industry information. Goodwill is recorded when consideration transferred exceeds the fair value of identifiable assets and liabilities. Measurement-period adjustments to assets acquired and liabilities assumed with a corresponding offset to goodwill are recorded in the period they occur, which may include up to one year from the acquisition date. Contingent consideration is recorded at fair value at the acquisition date.
Cash and Cash Equivalents. We consider our highly liquid investments with a maturity of three months or less at the time of purchase to be cash and cash equivalents.
Receivables, net. We do business with a significant number of customers, principally homebuilders and contractors. We monitor our exposure for credit losses on our customer receivable balances and the credit worthiness of our customers on an on-going basis. Expected credit losses are measured by segment using historical loss rate information adjusted for current conditions, with changes in the allowance recorded as a provision for (or reversal of) credit loss expense. Expected losses are charged against the allowance when management believes a receivable is uncollectible. During downturns in our markets, declines in the financial condition and creditworthiness of customers impact the credit risk of the receivables involved and we have incurred additional expense related to customer defaults. Receivables, net are presented net of certain allowances, including allowance for credit losses.
Inventories, net. Inventories, net consist primarily of insulation and insulation accessories, rain gutters, garage doors, fireplaces, glass and windows, shelving, and other products. We value inventory at the lower of cost or net realizable value, where cost is determined by the first in-first out cost method. Net realizable value is the estimated selling price in the ordinary course of business, less reasonably predictable cost of completion, disposal, and transportation. Inventory value is evaluated at each balance sheet date to ensure that it is carried at the lower of cost or net realizable value. Inventory provisions are recorded to reduce inventory to the lower of cost or net realizable value for obsolete or slow moving inventory based on assumptions about future demand and marketability of products, the impact of new product introductions, inventory levels and turns, product spoilage, and specific identification of items such as product discontinuance, engineering/material changes, or regulatory-related changes. As of December 31, 2021, and 2020, primarily all inventory consisted of finished goods.
Property and Equipment, net. Property and equipment, net, including significant improvements to existing facilities, are recorded at cost. Upon retirement or disposal, the cost and accumulated depreciation are removed from the accounts and any gain or loss is included in the Consolidated Statements of Operations. Maintenance and repair costs are charged against earnings as incurred. Gains and losses on the disposal of equipment are included in selling, general, and administrative expense.
We review our property and equipment as an event occurs or circumstances change that would more likely than not reduce the fair value of the property and equipment below the carrying amount. If the carrying amount is not recoverable from its undiscounted cash flows, we would recognize an impairment loss for the difference between the carrying amount and the current fair value. Further, we evaluate the remaining useful lives of property and equipment at each reporting period to determine whether events and circumstances warrant a revision to the remaining depreciation periods.
44
TOPBUILD CORP.
NOTES TO CONSOLIDATED FINANCIAL STATEMENTS
Depreciation. Depreciation expense is computed principally using the straight-line method over the estimated useful lives of the assets. Estimated useful lives are generally as follows:
Leases. At the inception of a contract, we determine whether the contract is, or contains, a lease based on the unique facts and circumstances present. Our facilities operating leases and various vehicle and equipment finance leases have lease and non-lease fixed cost components, which we account for as one single lease component in calculating the present value of minimum lease payments. Variable lease and non-lease cost components are expensed as incurred and are primarily included in cost of sales on the accompanying consolidated statement of operations.
Lease payments are recognized as an expense in the consolidated statements of operations on a straight-line basis over the lease term, including future option periods the Company reasonably expects to exercise, whereby an equal amount of rent expense is attributed to each period during the term of the lease, regardless of when actual payments are made. This generally results in rent expense in excess of cash payments during the early years of a lease and rent expense less than cash payments in later years. The difference between rent expense recognized and actual rental payments is typically represented as the spread between the ROU asset and lease liability.
We recognize a ROU asset and a lease liability at the lease commencement date. Our leases may include options to extend or terminate the lease, which will be reflected in the calculation of the lease liability and corresponding ROU asset when it is reasonably certain that we will exercise that option. We do not recognize ROU assets and lease liabilities for short-term leases that have an initial lease term of 12 months or less. We recognize the lease payments associated with short-term leases as an expense on a straight-line basis over the lease term.
The lease liability is initially measured as the present value of the unpaid lease payments as of the lease commencement date. The lease liability is discounted based on our IBR at the time of modification for an existing lease or at the time of lease commencement for new leases. Our IBR includes significant assumptions regarding our secured borrowing rates obtained on equipment note issuances and adjustments for differences in the remaining lease term, underlying assets and market conditions for companies with similar credit qualities as well as interest rate index fluctuations. The ROU asset is initially measured at cost, which comprises the initial amount of the lease liability adjusted for lease payments made at or before the lease commencement date, plus any initial direct costs incurred less any lease incentives received. The ROU asset is subsequently measured throughout the lease term as the carrying amount of the lease liability, plus initial direct costs, plus (minus) any prepaid (accrued) lease payments, less the unamortized balance of lease incentives received. Certain vehicle lease agreements have residual value guarantees at the end of the lease which require us to return the asset with a specified percentage of the original or other calculated value.
Fair Value. The fair value measurement standard defines fair value as the price that would be received to sell an asset, or paid to transfer a liability, in an orderly transaction between market participants at the measurement date (referred to as an “exit price”). A fair value hierarchy is established that prioritizes the inputs to valuation techniques used to measure fair value. The hierarchy gives the highest priority to unadjusted quoted market prices in active markets for identical assets and liabilities (Level 1 measurements) and the lowest priority to unobservable inputs (Level 3 measurements). The three levels of the fair value hierarchy are:
Level 1: Quoted prices in active markets for identical assets or liabilities.
Level 2: Observable inputs other than Level 1 prices, such as quoted market prices for similar assets or liabilities or other inputs that are observable or can be corroborated by market data.
Level 3: Unobservable inputs in which there is little or no market data, which require the reporting entity to develop its own assumptions.
45
TOPBUILD CORP.
NOTES TO CONSOLIDATED FINANCIAL STATEMENTS
Goodwill and Other Intangible Assets. We perform our annual impairment testing of goodwill in the fourth quarter of each year, or as events occur or circumstances change that would more likely than not reduce the fair value of a reporting unit below its carrying amount. We have defined our reporting units and completed the impairment testing of goodwill at the operating segment level. Our operating segments are reporting units that engage in business activities for which discrete financial information, including long-range forecasts, are available. When assessing goodwill for impairment, we have the option to first assess qualitative factors to determine whether the existence of events or circumstances leads to a determination that it is more likely than not that the fair value of a reporting unit is less than its carrying amount. If, after assessing the totality of events or circumstances, we determine it is more likely than not that the fair value of a reporting unit is less than its carrying amount, then we recognize an impairment charge for the amount by which the carrying amount exceeds the reporting unit’s fair value. If we conclude otherwise, then no further action is taken. We also have the option to bypass the qualitative assessment and only perform a quantitative assessment.
Fair value for our reporting units is determined using a discounted cash flow method, which includes significant unobservable inputs (Level 3 inputs). Using the discounted cash flow method requires us to make significant estimates and assumptions, including long term projections of cash flows, market conditions, and appropriate discount rates. Our judgments are based upon historical experience, current market trends, consultations with external valuation specialists and other information. In estimating future cash flows, we rely on internally generated long-range forecasts for sales and operating profits, including capital expenditures, and generally utilize a
Intangible assets with finite useful lives are amortized using the straight-line method over their estimated useful lives. We evaluate the remaining useful lives of amortizable intangible assets at each reporting period to determine whether events and circumstances warrant a revision to the remaining periods of amortization. For additional information, see Note 5 – Goodwill and Other Intangibles.
Insurance Reserves. We use a combination of high deductible and matching deductible insurance programs for a number of risks including, but not limited to, workers’ compensation, general liability, vehicle, and property liabilities. Our workers’ compensation insurance is primarily a high-deductible insurance program and our primary general liability insurance is a matching deductible program. We are insured for covered claims above the deductibles and retentions on an excess basis. The liabilities represent our best estimate of our costs, using generally accepted actuarial reserving methods, of the ultimate obligations for reported claims plus those incurred but not reported claims through December 31, 2021 and 2020. The accruals are adjusted as new information develops or circumstances change that would affect the estimated liability. We also record an insurance receivable for claims that exceeded the stop loss limit included in other assets on our Consolidated Balance Sheets which offsets an equal liability included within the reserve amount recorded in other liabilities on our Consolidated Balance Sheets. At December 31, 2021 and 2020, the amount of this receivable and liability was $
Advertising. Advertising costs are expensed as incurred. Advertising expense, net of manufacturers support, was approximately $
Share-based Compensation. Our share-based compensation program currently consists of RSAs and stock options. Share-based compensation expense is reported in selling, general, and administrative expense. We do not capitalize any compensation cost related to share-based compensation awards. The income tax benefits and deficiencies associated with share-based awards are reported as a component of income tax expense. Excess tax benefits and deficiencies are included in net cash provided by (used in) operating activities while shares withheld for tax-withholding are reported in financing activities under the caption “Taxes withheld and paid on employees’ equity awards” in our Consolidated Statements of Cash Flows. Award forfeitures are accounted for in the period they occur.
46
TOPBUILD CORP.
NOTES TO CONSOLIDATED FINANCIAL STATEMENTS
Award Type: | Fair Value Determination | Vesting | Expense | Expense |
Restricted Share Awards | ||||
Service Condition | Closing stock price on date of grant | Ratably; | Straight-line | Fair value at grant date |
Performance Condition | Closing stock price on date of grant | Cliff; | Straight-line; | Evaluated quarterly; |
Market Condition | Monte-Carlo Simulation | Cliff; | Straight-line; | Fair value at grant date |
Stock Options† | Black-Scholes Options Pricing Model | Ratably; | Straight-line | Fair value at grant date |
†Stock options expire no later than
‡Expense is reversed if award is forfeited prior to vesting.
Debt Issuance Costs. Debt issuance costs are amortized as interest expense over the life of the respective debt, which approximates the effective interest rate method. Unamortized debt issuance costs are presented as a direct deduction from the related debt on our Consolidated Balance Sheets.
Income Taxes. We account for income taxes using the asset and liability method, which requires recognition of deferred tax assets and liabilities for expected future tax consequences of temporary differences that currently exist between tax basis and financial reporting basis of our assets and liabilities. Deferred tax assets and liabilities are measured using enacted tax rates in the respective jurisdictions in which we operate.
Valuation allowances are established against deferred tax assets when it is more likely than not that the realization of those deferred tax assets will not occur. In evaluating our ability to recover our deferred tax assets within the jurisdiction from which they arise, we consider all available positive and negative evidence. If, based upon all available evidence, both positive and negative, it is more likely than not (more than 50 percent likely) such deferred tax assets will not be realized, a valuation allowance is recorded. Significant weight is given to positive and negative evidence that is objectively verifiable. A company’s three-year cumulative loss position is significant negative evidence in considering whether deferred tax assets are realizable and the accounting guidance restricts the amount of reliance we can place on projected taxable income to support the recovery of the deferred tax assets.
Only those income tax positions that have a greater than 50 percent likelihood of being sustained upon examination by taxing authorities are recognized. There is an increased potential for volatility in our effective tax rate because of future changes in the income tax environment and the inherent complexities of income tax law in the various jurisdictions. Accordingly, provisions for tax-related matters, including interest and penalties, could be recorded in income tax expense in the period revised assessments are made.
Foreign Currency. Foreign currency assets and liabilities are translated into United States dollars using the exchange rates in effect at the end of each reporting period. Equity accounts are translated at historical rates, except for the change in retained earnings during the year, which is the result of the income statement translation process. Revenue and expense accounts are translated using the weighted average exchange rate during the period. The cumulative translation adjustments associated with the net assets of foreign subsidiaries are recorded in accumulated other comprehensive loss on our Consolidated Statement of Stockholders’ Equity. Net foreign currency transaction gains and losses arising during the normal course of business are included in Other, net on our Consolidated Statement of Operations.
47
TOPBUILD CORP.
NOTES TO CONSOLIDATED FINANCIAL STATEMENTS
Recently Adopted Accounting Pronouncements
Income Taxes. In December 2019, the FASB issued ASU 2019-12, “Income Taxes (Topic 740), Simplifying the Accounting for Income Taxes.” This standard simplifies the accounting for income taxes by removing certain exceptions to the general principles included in current guidance, as well as improving consistent application of and simplifying GAAP for other areas by clarifying and amending existing guidance. We adopted this standard on January 1, 2021, using the modified retrospective method related to franchise taxes. There was no cumulative-effect adjustment recorded as of the beginning of 2021.
Credit Losses. In June 2016, the FASB issued ASU 2016-13, “Financial Instruments – Credit Losses (Topic 326), Measurement of Credit Losses on Financial Instruments,” which replaces the current incurred loss methodology with an expected loss methodology, referred to as the current expected credit loss (CECL) methodology. We adopted Topic 326 on January 1, 2020, using the modified retrospective method, which resulted in a $
The following table summarizes additional ASUs which were adopted, but did not have a material impact on our accounting policies or our consolidated financial statements and related disclosures:
ASU | Description | Period Adopted | Method | ||
ASU 2021-01 | Reference Rate Reform | 01/01/21 | Prospective | ||
ASU 2017-04 | Simplifying the Test for Goodwill Impairment | 01/01/20 | Prospective | ||
ASU 2018-13 | Disclosure Framework - Changes to the Disclosure Requirements for Fair Value Measurement | 01/01/20 | Prospective |
Recently Issued Accounting Pronouncements Not Yet Adopted
In October 2021, the FASB issued ASU 2021-08, “Accounting for Contract Assets and Contract Liabilities from Contracts with Customers”. This standard improves the accounting for acquired revenue contracts with customers in a business combination by addressing diversity in practice and inconsistency related to recognition of an acquired contract liability, as well as payment terms and their effect on subsequent revenue recognized by the acquirer. This standard is effective for us beginning January 1, 2023, with early adoption permitted. We are evaluating the impact that adoption of this standard may have on our financial position and results of operations.
2. LEASES
We lease various assets to support our business including warehouses for our installation branch locations and specialty distribution centers, office space for our Branch Support Center in Daytona Beach, Florida and other administrative locations, as well as fleet vehicles and certain equipment. In addition, we lease certain operating facilities from related parties, primarily former owners (and in certain cases, current management personnel) of companies acquired. These related party leases are immaterial to our consolidated statements of operations.
48
TOPBUILD CORP.
NOTES TO CONSOLIDATED FINANCIAL STATEMENTS
The following table presents lease-related assets and liabilities on the consolidated amounts recognized in our consolidated balance sheet, in thousands:
| Year Ended December 31, | |||||||||
2021 | 2020 | |||||||||
Assets | Classification | |||||||||
Operating | Right of use assets | $ | | $ | | |||||
Finance | | — | ||||||||
Total lease assets | $ | | $ | | ||||||
Liabilities | ||||||||||
Current | ||||||||||
Operating | Short-term operating lease liabilities | $ | | $ | | |||||
Finance | Short-term finance lease liabilities | | — | |||||||
Non-Current | ||||||||||
Operating | Long-term operating lease liabilities | | | |||||||
Finance | Long-term finance lease liabilities | | — | |||||||
Total lease liabilities | $ | | $ | | ||||||
Weighted-average remaining lease term: | ||||||||||
Operating leases | ||||||||||
Finance leases | — | |||||||||
Weighted-average discount rate: | ||||||||||
Operating leases | % | % | ||||||||
Finance leases | % | — | ||||||||
The components of lease expense were as follows and are primarily included in cost of sales on the accompanying consolidated statement of operations for operating leases and in selling, general and administrative expenses on the accompanying consolidated statement of operations for finance leases and operating leases on support centers, in thousands:
Year Ended December 31, | |||||||||
2021 | 2020 | 2019 | |||||||
Operating lease cost (a) | $ | | $ | | $ | | |||
Financing lease cost: | |||||||||
Amortization of leased assets | | — | — | ||||||
Interest on finance lease obligations | | — | — | ||||||
Short-term lease cost | | | | ||||||
Sublease income | ( | ( | ( | ||||||
Net lease cost | $ | | $ | | $ | | |||
| (a) | Includes variable cost components of $ |
49
TOPBUILD CORP.
NOTES TO CONSOLIDATED FINANCIAL STATEMENTS
Future minimum lease payments under non-cancellable operating leases as of December 31, 2021 were as follows, in thousands:
Payments due by Period |
| ||
2022 | $ | ||
2023 | |||
2024 | |||
2025 | |||
2026 | |||
2027 and Thereafter | |||
Total future minimum lease payments | | ||
Less: imputed interest | ( | ||
Lease liability at December 31, 2021 | $ | | |
The amounts below are included in the cash flows provided by operating activities section on the accompanying consolidated statement of cash flows, in thousands:
| Year Ended December 31, | ||||||||
2021 | 2020 | 2019 | |||||||
Cash paid for amounts included in the measurement of lease liabilities: | |||||||||
Operating cash flows from finance leases | $ | ( | $ | — | $ | — | |||
Operating cash flows from operating leases | ( | ( | ( | ||||||
Financing cash flows from finance leases | ( | — | — | ||||||
3. REVENUE RECOGNITION
Revenue is disaggregated between our Installation and Specialty Distribution segments and further based on market and product, as we believe this best depicts how the nature, amount, timing, and uncertainty of revenue and cash flows are affected by economic factors. The following tables present our revenues disaggregated by market (in thousands):
Year Ended December 31, 2021 | ||||||||||||
Installation | Specialty Distribution | Elims | Total | |||||||||
Residential | $ | | $ | | $ | ( | $ | | ||||
Commercial | | | ( | | ||||||||
Industrial | — | | — | | ||||||||
Net sales | $ | | $ | | $ | ( | $ | | ||||
Year Ended December 31, 2020 | ||||||||||||
Installation | Specialty Distribution | Elims | Total | |||||||||
Residential | $ | | $ | | $ | ( | $ | | ||||
Commercial | | | ( | | ||||||||
Net sales | $ | | $ | | $ | ( | $ | | ||||
Year Ended December 31, 2019 | ||||||||||||
Installation | Specialty Distribution | Elims | Total | |||||||||
Residential | $ | | $ | | $ | ( | $ | | ||||
Commercial | | | ( | | ||||||||
Net sales | $ | | $ | | $ | ( | $ | | ||||
50
TOPBUILD CORP.
NOTES TO CONSOLIDATED FINANCIAL STATEMENTS
The following tables present our revenues disaggregated by product (in thousands):
Year Ended December 31, 2021 | ||||||||||||
Installation | Specialty Distribution | Elims | Total | |||||||||
Insulation and accessories | $ | | $ | | $ | ( | $ | | ||||
Glass and windows | | — | — | | ||||||||
Gutters | | | ( | | ||||||||
All other | | | ( | | ||||||||
Net sales | $ | | $ | | $ | ( | $ | | ||||
Year Ended December 31, 2020 | ||||||||||||
Installation | Specialty Distribution | Elims | Total | |||||||||
Insulation and accessories | $ | | $ | | $ | ( | $ | | ||||
Glass and windows | | — | — | | ||||||||
Gutters | | | ( | | ||||||||
All other | | | ( | | ||||||||
Net sales | $ | | $ | | $ | ( | $ | | ||||
Year Ended December 31, 2019 | ||||||||||||
Installation | Specialty Distribution | Elims | Total | |||||||||
Insulation and accessories | $ | | $ | | $ | ( | $ | | ||||
Glass and windows | | — | — | | ||||||||
Gutters | | | ( | | ||||||||
All other | | | ( | | ||||||||
Net sales | $ | | $ | | $ | ( | $ | | ||||
The following table represents our contract assets and contract liabilities with customers, in thousands:
Included in Line Item on | As of | ||||||
Condensed | December 31, | December 31, | |||||
Balance Sheets | 2021 | 2020 | |||||
Contract Assets: | |||||||
Receivables, unbilled | Receivables, net | $ | | $ | | ||
Contract Liabilities: | |||||||
Deferred revenue | Accrued liabilities | $ | | $ | | ||
The aggregate amount remaining on uncompleted performance obligations was $
On certain of our long-term contracts, a percentage of the total project cost is withheld and not invoiced to the customer and collected until satisfactory completion of the customer’s project, typically within a year. This amount is referred to as retainage and is common practice in the construction industry. Retainage receivables are classified as a component of Receivables, net on our Consolidated Balance Sheets and were $
51
TOPBUILD CORP.
NOTES TO CONSOLIDATED FINANCIAL STATEMENTS
4. PROPERTY & EQUIPMENT
The following table sets forth our property and equipment by class as of December 31, 2021 and 2020, in thousands:
As of December 31, | ||||||
2021 | 2020 | |||||
Land and improvements | $ | | $ | | ||
Buildings | | | ||||
Equipment | | | ||||
Computer hardware and software | | | ||||
Company vehicles | | | ||||
| | |||||
Less: Accumulated depreciation | ( | ( | ||||
Total property and equipment, net | $ | | $ | | ||
For additions to property and equipment as a result of 2021 acquisitions, see Note 15 – Business Combinations. As of December 31, 2021, property and equipment, net on our Consolidated Balance Sheet includes $
Depreciation expense was $
5. GOODWILL AND OTHER INTANGIBLES
We have
In the fourth quarters of 2021 and 2020, we performed annual qualitative assessments of our goodwill resulting in
Changes in the carrying amount of goodwill for the years ended December 31, 2021 and 2020, by segment, were as follows, in thousands:
|
|
| Fx |
| Accumulated |
| ||||||||||||
Gross Goodwill | Translation | Gross Goodwill | Impairment | Net Goodwill | ||||||||||||||
December 31, 2020 | Additions | Adjustment | December 31, 2021 | Losses | December 31, 2021 | |||||||||||||
Goodwill, by segment: | ||||||||||||||||||
Installation | $ | | $ | | — | $ | | $ | ( | $ | | |||||||
Specialty Distribution |
| |
| | ( |
| |
| — |
| | |||||||
Total goodwill | $ | | $ | | $ | ( | $ | | $ | ( | $ | | ||||||
|
|
|
| Accumulated |
| ||||||||||
Gross Goodwill | Gross Goodwill | Impairment | Net Goodwill | ||||||||||||
December 31, 2019 | Additions | December 31, 2020 | Losses | December 31, 2020 | |||||||||||
Goodwill, by segment: | |||||||||||||||
Installation | $ | | $ | | $ | | $ | ( | $ | | |||||
Specialty Distribution |
| |
| — |
| |
| — |
| | |||||
Total goodwill | $ | | $ | | $ | | $ | ( | $ | | |||||
52
TOPBUILD CORP.
NOTES TO CONSOLIDATED FINANCIAL STATEMENTS
The following table sets forth our other intangible assets, in thousands:
As of December 31, | |||||||||
2021 | 2020 | 2019 | |||||||
Gross definite-lived intangible assets |
| $ | | $ | | $ | | ||
Accumulated amortization |
| ( | ( | ( | |||||
Net definite-lived intangible assets |
| | | | |||||
Indefinite-lived intangible assets not subject to amortization |
| — | — | — | |||||
Other intangible asset, net | $ | | $ | | $ | | |||
Amortization expense | $ | | $ | | $ | | |||
The following table sets forth a breakout of our intangible assets as of December 31, 2021, in thousands:
|
|
|
| Gross Definite-lived Intangible Assets |
| Accumulated Amortization |
| Net Definite-lived Intangible Assets | ||||
Trademarks | $ | | $ | ( | $ | | ||||||
Customer relationships | | ( | | |||||||||
Non-compete | | ( | | |||||||||
Total | $ | | $ | ( | $ | | ||||||
The following table sets forth the amortization expense related to the definite-lived intangible assets during each of the next five years, in thousands:
| Amortization | ||
2022 | $ | | |
2023 | | ||
2024 | | ||
2025 | | ||
2026 | | ||
See Note 15 – Business Combinations for breakout by major intangible asset class and their weighted average estimated useful lives.
53
TOPBUILD CORP.
NOTES TO CONSOLIDATED FINANCIAL STATEMENTS
6. LONG-TERM DEBT
The following table reconciles the principal balances of our outstanding debt to our Consolidated Balance Sheets, in thousands:
As of December 31, | ||||||
2021 |
| 2020 | ||||
$ | | $ | — | |||
| — | |||||
— | | |||||
Term loan | | | ||||
Equipment notes | | | ||||
Unamortized debt issuance costs | ( | ( | ||||
Total debt, net of unamortized debt issuance costs | | | ||||
Less: current portion of long-term debt | | | ||||
Total long-term debt | $ | | $ | | ||
The following table sets forth our remaining principal payments for our outstanding debt balances as of December 31, 2021, in thousands:
Payments Due by Period | |||||||||||||||||||||
2022 | 2023 | 2024 | 2025 | 2026 | Thereafter | Total | |||||||||||||||
$ | — | $ | — | $ | — | $ | — | $ | — | $ | | $ | | ||||||||
— | — | — | — | — | | | |||||||||||||||
Term loan |
| | | | | | — |
| | ||||||||||||
Equipment notes | | | | — | — | — | | ||||||||||||||
Total | $ | | $ | | $ | | $ | | $ | | $ | | $ | | |||||||
Amendments to Credit Agreement and Senior Secured Term Loan Facility
On March 8, 2021, the Company entered into Amendment No. 1 to Credit Agreement. Amendment No. 1 to Credit Agreement provided for a term loan facility in an aggregate principal amount of $
The maturity date for the loans under Amendment No. 1 to Credit Agreement was extended from March 2025 to March 2026, the floor for base rate loans was reduced from
On October 7, 2021, the Company entered into Amendment No. 2 to Credit Agreement. Amendment No. 2 to Credit Agreement provides for a term loan facility in an aggregate principal amount of $
54
TOPBUILD CORP.
NOTES TO CONSOLIDATED FINANCIAL STATEMENTS
The following table outlines the key terms of Amendment No. 2 to Credit Agreement (dollars in thousands):
Senior secured term loan facility | $ | | |
Additional delayed draw term loan | $ | | |
Additional term loan and/or revolver capacity available under incremental facility (a) | $ | | |
Revolving facility | $ | | |
Sublimit for issuance of letters of credit under revolving facility (b) | $ | | |
Sublimit for swingline loans under revolving facility (b) | $ | | |
Interest rate as of December 31, 2021 | | % | |
Scheduled maturity date |
| (a) | Additional borrowing capacity is available under the incremental facility, subject to certain terms and conditions (including existing or new lenders providing commitments in respect of such additional borrowing capacity). |
| (b) | Use of the sublimits for the issuance of letters of credit and swingline loans reduces the availability under the revolving facility. |
Interest payable on borrowings under Amendment No. 2 to Credit Agreement is based on an applicable margin rate plus, at our option, either:
| ● | A base rate determined by reference to the highest of either (i) the federal funds rate plus |
| ● | A LIBOR rate (or a comparable successor rate) determined by reference to the costs of funds for deposits in U.S. dollars for the interest period relevant to such borrowings, subject to a floor of |
Amendment No. 2 to Credit Agreement contemplates future amendment by the Company and the agent to provide for the replacement of LIBOR with another alternate benchmark rate, giving due consideration to any evolving or then existing convention for similar U.S. dollar denominated syndicated credit facilities for such alternative benchmarks, including any related mathematical or other applicable adjustments.
The applicable margin rate is determined based on our Secured Leverage Ratio. In the case of base rate borrowings, the applicable margin rate ranges from
Revolving Facility
The Company has outstanding standby letters of credit that secure our financial obligations related to our workers’ compensation, general insurance, and auto liability programs. These standby letters of credit, as well as any outstanding amount borrowed under our revolving facility, reduce the availability under the revolving facility. The following table summarizes our availability under the revolving facility, in thousands:
As of December 31, | ||||||
| 2021 |
| 2020 | |||
Revolving facility | $ | | $ | | ||
Less: standby letters of credit | ( | ( | ||||
Availability under revolving facility | $ | | $ | | ||
We are required to pay commitment fees to the Lenders in respect of any unutilized commitments. The commitment fees range from
55
TOPBUILD CORP.
NOTES TO CONSOLIDATED FINANCIAL STATEMENTS
On March 15, 2021, the Company completed a private offering of $
The Company may redeem the
On October 14, 2021, the Company completed a private offering of $
The Company may redeem the
Equipment Notes
We did not issue equipment notes during the year ended December 31, 2021. The company issued $
56
TOPBUILD CORP.
NOTES TO CONSOLIDATED FINANCIAL STATEMENTS
Covenant Compliance
The indentures governing our
The Credit Agreement contains certain covenants that limit, among other things, the ability of the Company to incur additional indebtedness or liens; to make certain investments or loans; to make certain restricted payments; to enter into consolidations, mergers, sales of material assets, and other fundamental changes; to transact with affiliates; to enter into agreements restricting the ability of subsidiaries to incur liens or pay dividends; or to make certain accounting changes. The Credit Agreement contains customary affirmative covenants and events of default.
The Credit Agreement requires that we maintain a Net Leverage Ratio and minimum Interest Coverage Ratio throughout the term of the agreement. The following table outlines the key financial covenants effective for the period covered by this Quarterly Report:
As of December 31, 2021 | ||
Maximum Net Leverage Ratio | ||
Minimum Interest Coverage Ratio | ||
Compliance as of period end | In Compliance |
7. FAIR VALUE MEASUREMENTS
Fair Value on Recurring Basis
The carrying values of cash and cash equivalents, receivables, net, and accounts payable are considered to be representative of their respective fair values due to the short-term nature of these instruments. We measure our contingent consideration liabilities related to business combinations at fair value. For more information see Note 15 – Business Combinations.
Fair Value on Non-Recurring Basis
Fair value measurements were applied to our long-term debt portfolio. We believe the carrying value of our term loan approximates the fair market value primarily due to the fact that the non-performance risk of servicing our debt obligations, as reflected in our business and credit risk profile, has not materially changed since we assumed our debt obligations under the Amendment No. 2 to Credit Agreement. In addition, due to the floating-rate nature of our term loan, the market value is not subject to variability solely due to changes in the general level of interest rates as is the case with a fixed-rate debt obligation. Based on active market trades of our
As of December 31, 2021 | ||||||
Fair Value | Gross Carrying Value | |||||
| | |||||
| | |||||
57
TOPBUILD CORP.
NOTES TO CONSOLIDATED FINANCIAL STATEMENTS
During all periods presented, there were
8. SEGMENT INFORMATION
Our reportable segments are Installation and Specialty Distribution.
Our Installation segment installs insulation and other building products. We sell primarily to the residential new construction market, with increasing activity in both the commercial construction industry and repair/remodel of residential housing. In addition to insulation, we install other building products including glass and windows, rain gutters, afterpaint products, fireproofing, garage doors, and fireplaces.
Our Specialty Distribution segment distributes building and mechanical insulation, insulation accessories and other building product materials for the residential, commercial, and industrial end markets. In addition to insulation and accessories, it distributes rain gutters, fireplaces, closet shelving, and roofing materials, among other items. Distributed products are sold from distribution centers in various parts of the United States and Canada, primarily to contractors and dealers (including lumber yards) serving a wide variety of commercial and industrial industries.
Our Chief Operating Decision Maker regularly reviews financial information of our segments in determining resource allocation and assessing performance. The key performance metric we use to evaluate our businesses is segment operating profit. Operating profit for the individual segments includes corporate costs which are allocated to the segments based on various metrics including sales and headcount.
Intercompany sales from the Specialty Distribution segment to the Installation segment are recorded by the Specialty Distribution segment with a profit margin and by our Installation segment at cost.
Key information by segment is as follows, for the years ended December 31, in thousands:
Net Sales | Operating Profit (b) | |||||||||||||||||
2021 | 2020 | 2019 | 2021 | 2020 | 2019 | |||||||||||||
Our operations by segment were (a): |
|
|
|
|
|
|
|
|
|
|
|
| ||||||
Installation | $ | | $ | | $ | | $ | | $ | | $ | | ||||||
Specialty Distribution | | | | | | | ||||||||||||
Intercompany eliminations and other adjustments | ( | ( | ( | ( | ( | ( | ||||||||||||
Total | $ | | $ | | $ | | | | | |||||||||
General corporate expense, net (c) | ( | ( | ( | |||||||||||||||
Operating profit, as reported | | | | |||||||||||||||
Other expense, net | ( | ( | ( | |||||||||||||||
Income before income taxes | $ | | $ | | $ | | ||||||||||||
| Property Additions |
| Depreciation and |
| Total Assets | |||||||||||||||||||
| 2021 |
| 2020 |
| 2019 |
| 2021 |
| 2020 |
| 2019 |
| 2021 |
| 2020 | |||||||||
Our operations by segment were (a): |
|
|
|
|
|
|
|
| ||||||||||||||||
Installation |
| $ | | $ | | $ | | $ | | $ | | $ | | $ | | $ | | |||||||
Specialty Distribution |
| | | | | | | | | |||||||||||||||
Corporate |
| | | | | | | | | |||||||||||||||
Total, as reported |
| $ | | $ | | $ | | $ | | $ | | $ | | $ | | $ | | |||||||
(a) | All of our operations are located in the U.S. and Canada. |
(b) | Segment operating profit includes an allocation of general corporate expenses attributable to the operating segments which is based on direct benefit or usage (such as salaries of corporate employees who directly support the segment). |
(c) | General corporate expense, net includes expenses not specifically attributable to our segments for functions such as corporate human resources, finance, and legal, including salaries, benefits, and other related costs. |
58
TOPBUILD CORP.
NOTES TO CONSOLIDATED FINANCIAL STATEMENTS
9. ACCRUED LIABILITIES
The following table sets forth the components of accrued liabilities, in thousands:
As of December 31, | ||||||
| 2021 |
| 2020 | |||
Accrued liabilities: | ||||||
Salaries, wages, and commissions | $ | | $ | | ||
Insurance liabilities | | | ||||
Customer rebates | | | ||||
Deferred revenue | | | ||||
Employee tax-related liabilities | | | ||||
Sales & Property taxes | | | ||||
Interest payable on long-term debt | | | ||||
Other | | | ||||
Total accrued liabilities | $ | | $ | | ||
As of December 31, 2021 and 2020, employee tax-related liabilities included $
10. EMPLOYEE RETIREMENT PLANS
We provide a defined-contribution retirement plan for substantially all employees. In addition, we participate in
The expense related to our participation in the retirement plans was as follows, in thousands:
Years Ended December 31, | |||||||||
| 2021 |
| 2020 |
| 2019 | ||||
Defined contribution plans | $ | | $ | | $ | | |||
Multi-employer plans | | | | ||||||
$ | | $ | | $ | | ||||
The Pension Protection Act (“PPA”) defines a zone status for multi-employer pension plans. Plans in the green zone are at least 80 percent funded, plans in the yellow zone are at least 65 percent funded and plans in the red zone are generally less than 65 percent funded.
We participate in the Carpenters Pension Trust Fund for Northern California (“NCT”), which is our third largest multi-employer plan expense and is in the red zone. The NCT has implemented a funding rehabilitation plan in accordance with government requirements. Our contributions to NCT have not exceeded
Employer | ||||||||||||||||
Identification | PPA Zone Status | Funding Plan | Contributions (in thousands) | Surcharge | ||||||||||||
Pension Fund | Number/Plan Number | 2021 | 2020 | Pending / Implemented | 2021 | 2020 | 2019 | Imposed | ||||||||
NCT | 94-6050970/001 | Red | Red | Yes | $ | $ | $ | No | ||||||||
59
TOPBUILD CORP.
NOTES TO CONSOLIDATED FINANCIAL STATEMENTS
11. OTHER COMMITMENTS AND CONTINGENCIES
Litigation. We are subject to certain claims, charges, litigation, and other proceedings in the ordinary course of our business, including those arising from or related to contractual matters, intellectual property, personal injury, environmental matters, product liability, product recalls, construction defects, insurance coverage, personnel and employment disputes, antitrust, and other matters, including class actions. We believe we have adequate defenses in these matters, and we do not believe that the ultimate outcome of these matters will have a material adverse effect on us. However, there is no assurance that we will prevail in any of these pending matters, and we could in the future incur judgments, enter into settlements of claims, or revise our expectations regarding the outcome of these matters, which could materially impact our liquidity and our results of operations.
Other Matters. We enter into contracts, which include customary indemnities that are standard for the industries in which we operate. Such indemnities include, among other things, customer claims against builders for issues relating to our products and workmanship. In conjunction with divestitures and other transactions, we occasionally provide customary indemnities relating to various items including, among others: the enforceability of trademarks, legal and environmental issues, and asset valuations. We evaluate the probability that we may incur liabilities under these customary indemnities and appropriately record an estimated liability when deemed probable.
We also maintain indemnification agreements with our directors and officers that may require us to indemnify them against liabilities that arise by reason of their status or service as directors or officers, except as prohibited by applicable law.
We occasionally use performance bonds to ensure completion of our work on certain larger customer contracts that can span multiple accounting periods. Performance bonds generally do not have stated expiration dates; rather, we are released from the bonds as the contractual performance is completed. We also have bonds outstanding for license and insurance.
The following table summarizes our outstanding performance, licensing, insurance and other bonds, in thousands:
As of December 31, | ||||||
2021 | 2020 | |||||
Outstanding bonds: | ||||||
Performance bonds | $ | | $ | | ||
Licensing, insurance, and other bonds | | | ||||
Total bonds | $ | | $ | | ||
60
TOPBUILD CORP.
NOTES TO CONSOLIDATED FINANCIAL STATEMENTS
12. INCOME TAXES
(In thousands) | 2021 | 2020 | 2019 | ||||||
Income before income taxes: | |||||||||
U.S. | $ | | $ | | $ | | |||
Foreign | | — | — | ||||||
Total | $ | | $ | | $ | | |||
Income tax expense (benefit): | |||||||||
Currently payable: | |||||||||
U.S. Federal | $ | | $ | | $ | | |||
State and local | | | | ||||||
Foreign | | — | — | ||||||
Deferred: | |||||||||
U.S. Federal | ( | ( | ( | ||||||
State and local | | | | ||||||
Foreign | ( | — | — | ||||||
$ | | $ | | $ | | ||||
Deferred tax assets at December 31: | |||||||||
Receivables, net | $ | | $ | | |||||
Inventories, net | | | |||||||
Other assets, principally share-based compensation | | | |||||||
Accrued liabilities | | | |||||||
Lease liability | | | |||||||
Long-term liabilities | | | |||||||
Long-term lease liability | | | |||||||
Net operating loss carryforward | | | |||||||
Disallowed interest carryforward | | — | |||||||
| | ||||||||
Deferred tax liabilities at December 31: | |||||||||
Right of use assets | | | |||||||
Property and equipment, net | | | |||||||
Intangibles, net | | | |||||||
Other | | | |||||||
| | ||||||||
Net deferred tax liability at December 31 | $ | | $ | | |||||
A valuation allowance must be established for deferred tax assets when it is more-likely-than-not that they will not be realized. After review of all available positive and negative evidence, the Company has determined that
At December 31, 2021, the net deferred tax liability of $
Of the deferred tax asset related to the net operating loss at December 31, 2021, $
The deferred tax asset related to disallowed interest is not subject to expiration.
61
TOPBUILD CORP.
NOTES TO CONSOLIDATED FINANCIAL STATEMENTS
A reconciliation of the U.S. Federal statutory tax rate to the income tax expense (benefit) on income was as follows:
2021 | 2020 | 2019 | |||||||
U.S. Federal statutory tax rate | | % | | % | | % | |||
State and local taxes, net of U.S. Federal tax benefit | | | | ||||||
Share based compensation | ( | ( | ( | ||||||
Non-deductible/non-taxable items (1) | | | | ||||||
Other, net (1) | | | | ||||||
Effective tax rate | | % | | % | | % |
| (1) | Certain prior year percentages have been reclassified to conform to the current year presentation. |
A tax benefit of $
We file income tax returns in the U.S. Federal jurisdiction, various U.S. state and local jurisdictions, and foreign jurisdictions. With few exceptions, we are no longer subject to income tax examinations on filed returns for years before 2017.
As of December 31, 2021, there are
13. NET INCOME PER SHARE
Basic net income per share is calculated by dividing net income by the weighted average shares outstanding during the period, without consideration for common stock equivalents.
Diluted net income per share is calculated by adjusting weighted average shares outstanding for the dilutive effect of common stock equivalents outstanding for the period, determined using the treasury stock method.
Basic and diluted net income per share were computed as follows:
Years Ended December 31, | |||||||||
2021 | 2020 | 2019 | |||||||
Net income (in thousands) - basic and diluted | $ | | $ | | $ | | |||
Weighted average number of common shares outstanding - basic | | | | ||||||
Dilutive effect of common stock equivalents: | |||||||||
RSAs with service-based conditions | | | | ||||||
RSAs with market-based conditions | | | | ||||||
RSAs with performance-based conditions | | | | ||||||
Stock options | | | | ||||||
Weighted average number of common shares outstanding - diluted | | | | ||||||
Basic net income per common share | $ | | $ | | $ | | |||
Diluted net income per common share | $ | | $ | | $ | | |||
62
TOPBUILD CORP.
NOTES TO CONSOLIDATED FINANCIAL STATEMENTS
The following table summarizes shares excluded from the calculation of diluted net income per share because their effect would have been anti-dilutive:
Years Ended December 31, | |||||||||
2021 | 2020 | 2019 | |||||||
Anti-dilutive common stock equivalents: | |||||||||
RSAs with service-based conditions | | | | ||||||
RSAs with market-based conditions | | | | ||||||
RSAs with performance-based conditions | — | — | — | ||||||
Stock options | | | | ||||||
Total anti-dilutive common stock equivalents | | | | ||||||
14. SHARE-BASED COMPENSATION
Effective July 1, 2015, our eligible employees commenced participation in the 2015 LTIP. The 2015 LTIP authorizes the Board to grant stock options, stock appreciation rights, restricted shares, restricted share units, performance awards, and dividend equivalents. All grants are made by issuing new shares and no more than
Share-based compensation expense is included in selling, general, and administrative expense. The income tax effect associated with share-based compensation awards is included in income tax expense.
The following table presents share-based compensation amounts recognized in our consolidated statements of operations, in thousands:
Year Ended December 31, | |||||||||
2021 | 2020 | 2019 | |||||||
Share-based compensation expense | $ | | $ | | $ | | |||
Income tax benefit | $ | | $ | | $ | | |||
The following table presents a summary of our share-based compensation activity for the year ended December 31, 2021, in thousands, except per share amounts:
RSAs | Stock Options | |||||||||||||||
Number of Shares |
| Weighted Average Grant Date Fair Value Per Share |
| Number of Shares |
| Weighted Average Grant Date Fair Value Per Share |
| Weighted Average Exercise Price Per Share |
| Aggregate | ||||||
Balance December 31, 2020 | | $ | | | $ | | $ | | $ | | ||||||
Granted | | $ | | | $ | | $ | | ||||||||
Converted/Exercised | ( | $ | | ( | $ | | $ | | $ | | ||||||
Forfeited/Expired | ( | $ | | — | $ | — | $ | — | ||||||||
Balance December 31, 2021 | | $ | | | $ | | $ | | $ | | ||||||
Exercisable December 31, 2021 (a) | | $ | | $ | | $ | | |||||||||
| (a) | The weighted average remaining contractual term for vested stock options is |
63
TOPBUILD CORP.
NOTES TO CONSOLIDATED FINANCIAL STATEMENTS
We had unrecognized share-based compensation expense relating to unvested awards as shown in the following table, dollars in thousands:
As of December 31, 2021 | ||||||
Unrecognized Compensation Expense | Weighted Average | |||||
RSAs | $ | | ||||
Stock options | | |||||
Total unrecognized compensation expense related to unvested awards | $ | | ||||
Our RSAs with performance-based conditions are evaluated on a quarterly basis with adjustments to compensation expense based on the likelihood of the performance target being achieved or exceeded. The following table shows the range of payouts and the related expense for our outstanding RSAs with performance-based conditions, in thousands:
Payout Ranges and Related Expense | |||||||||||||||
RSAs with Performance-Based Conditions | Grant Date Fair Value | ||||||||||||||
February 18, 2019 | $ | | $ | — | $ | | $ | | $ | | |||||
February 17, 2020 | $ | | $ | — | $ | | $ | | $ | | |||||
February 16, 2021 | $ | | $ | — | $ | | $ | | $ | | |||||
During the first quarter of 2021, RSAs with performance-based conditions that were granted on February 19, 2018, vested based on cumulative
The fair value of our RSAs with a market-based condition granted under the 2015 LTIP was determined using a Monte Carlo simulation. The following are key inputs in the Monte Carlo analysis for awards granted in 2021 and 2020:
2021 | 2020 | |||||||
Measurement period (years) | ||||||||
Risk free interest rate | | % | | % | ||||
Dividend yield | | % | | % | ||||
Estimated fair value of market-based RSAs at grant date | $ | | $ | | ||||
The fair value of stock options granted under the 2015 LTIP was calculated using the Black-Scholes Options Pricing Model. The following table presents the assumptions used to estimate the fair values of the stock options granted in 2021 and 2020:
2021 | 2020 | |||||||
Risk free interest rate | | % | | % | ||||
Expected volatility, using historical return volatility and implied volatility | | % | | % | ||||
Expected life (in years) | ||||||||
Dividend yield | | % | | % | ||||
Estimated fair value of stock options at grant date | $ | | $ | | ||||
64
TOPBUILD CORP.
NOTES TO CONSOLIDATED FINANCIAL STATEMENTS
15. BUSINESS COMBINATIONS
We continue to acquire businesses as part of our ongoing strategy to grow our company and expand our market share. Each acquisition has been accounted for as a business combination under ASC 805, “Business Combinations.” Acquisition related costs for the years ended December 31, 2021 and 2020, were $
2021 Acquisitions | Date |
| Cash Paid | Contingent Consideration | Total Purchase Price | Goodwill Acquired | Net Sales | Net (Loss) Income | |||||||||||||
LCR | 1/20/2021 | $ | | $ | — | $ | | $ | | $ | | $ | ( | ||||||||
ABS | 4/5/2021 | | — | | | | | ||||||||||||||
DI | 10/15/2021 | | — | | | | ( | ||||||||||||||
All others | Various | | | | | | | ||||||||||||||
Total | $ | | $ | | $ | | $ | | $ | | $ | | |||||||||
Pro Forma Results- DI Acquisition
The following unaudited pro forma information has been prepared as if the acquisition of DI, as described above, had taken place on January 1, 2020. The unaudited pro forma information is not necessarily indicative of the results that we would have achieved had the transaction actually taken place on January 1, 2020. Further, the unaudited pro forma information does not purport to be indicative of future financial operating results. Our unaudited pro forma results are presented below, in thousands:
Unaudited Pro Forma for the | ||||||
Year Ended December 31, | ||||||
| 2021 |
| 2020 | |||
Net sales | $ | | $ | | ||
Net income | $ | | $ | | ||
The following table details the additional expense included in the unaudited pro forma operating income as if the acquisition of DI had taken place on January 1, 2020. Our unaudited pro forma results are presented below, in thousands:
Unaudited Pro Forma for the | ||||||
Year Ended December 31, | ||||||
| 2021 |
| 2020 | |||
Depreciation & amortization | $ | | $ | | ||
Income tax benefit (using | $ | ( | $ | ( | ||
The proforma impact of all other 2021 acquisitions were immaterial to our results of operations for the years ended December 31, 2021 and 2020.
65
TOPBUILD CORP.
NOTES TO CONSOLIDATED FINANCIAL STATEMENTS
Purchase Price Allocations
The estimated fair values of the assets acquired and liabilities assumed for the 2021 acquisitions, as well as the fair value
of consideration transferred, approximated the following as of December 31, 2021, in thousands:
2021 Acquisitions | |||||||||||||||
| LCR |
| ABS | DI | All others | Total | |||||||||
Estimated fair values: | |||||||||||||||
Accounts receivable | | | | | | ||||||||||
Inventories | | | | | | ||||||||||
Prepaid and other assets | | | | | | ||||||||||
Property and equipment | | | | | | ||||||||||
ROU asset (operating) | | | | | | ||||||||||
Intangible assets | | | | | | ||||||||||
Goodwill | | | | | | ||||||||||
Accounts payable | ( | — | ( | ( | ( | ||||||||||
Lease liabilities | ( | ( | ( | ( | ( | ||||||||||
Deferred tax liabilities | | | ( | | ( | ||||||||||
All other liabilities | ( | ( | ( | | ( | ||||||||||
Net assets acquired | $ | | $ | | $ | | $ | | $ | | |||||
2021 Acquisitions | |||||||||||||||
| LCR |
| ABS |
| DI | All others | Total | ||||||||
Fair value of consideration transferred: | |||||||||||||||
Cash | $ | | $ | | $ | | $ | | $ | | |||||
Deferred consideration | — | — | — | — | |||||||||||
Contingent consideration | — | — | — | | | ||||||||||
Total consideration transferred | $ | | $ | | $ | | $ | | $ | | |||||
Estimates of acquired intangible assets related to the 2021 acquisitions are as follows, as of December 31, 2021, dollars in thousands:
| Estimated Fair Value |
| Weighted Average Estimated Useful Life (Years) | |||
2021 Acquisitions | ||||||
Customer relationships | $ | | ||||
Trademarks and trade names | | |||||
Total intangible assets acquired | $ | | ||||
The acquisition of DI comprises $
The table below provides a summary as of December 31, 2021 for businesses acquired during the year ended December 31, 2020:
2020 Acquisitions | Date |
| Cash Paid | Contingent Consideration | Total Purchase Price | Goodwill Acquired | Net Sales | Net (Loss) Income | |||||||||||||
Cooper | 2/20/2020 | $ | | $ | | $ | | $ | | $ | | $ | ( | ||||||||
Hunter | 2/24/2020 | | — | | | | ( | ||||||||||||||
Garland | 10/1/2020 | | — | | | | | ||||||||||||||
Total | $ | | $ | | $ | | $ | | $ | | $ | | |||||||||
66
TOPBUILD CORP.
NOTES TO CONSOLIDATED FINANCIAL STATEMENTS
As third-party or internal valuations are finalized, certain tax aspects of the foregoing transactions are completed, and customer post-closing reviews are concluded, adjustments may be made to the fair value of assets acquired, and in some cases total purchase price, through the end of each measurement period, generally one year following the applicable acquisition date. Goodwill to be recognized in connection with these acquisitions is attributable to the synergies expected to be realized and improvements in the businesses after the acquisitions. Primarily all of the goodwill recorded for the year ended December 31, 2021 and 2020, respectively, is deductible for income tax purposes with the exception of Distribution International. Of the goodwill recorded from the acquisition of Distribution International $
Contingent Consideration
The acquisition of Viking included a contingent consideration arrangement that requires additional consideration to be paid by TopBuild based on the achievement of annual gross revenue targets over a
The acquisition of Cooper includes a contingent consideration arrangement that requires additional consideration to be paid by TopBuild based on the achievement of annual gross revenue targets over a
The acquisition of Valley includes a contingent consideration arrangement that requires additional consideration to be paid by TopBuild based on the achievement of annual gross revenue targets over a
Payments of contingent consideration are classified as either financing or operating activities on our condensed consolidated statement of cash flows in accordance with ASC 230-10-45. The following table presents the fair value of contingent consideration, in thousands:
| Viking |
| Cooper | Valley | |||||
Date of Acquisition | July 15, 2019 | February 20, 2020 | August 23, 2021 | ||||||
Fair value of contingent consideration recognized at acquisition date | $ | | $ | | $ | | |||
Contingent consideration at December 31, 2020 | $ | | $ | | $ | — | |||
Additions | — | — | | ||||||
Change in fair value of contingent consideration during the year ended December 31, 2021 | | ( | — | ||||||
Payment of contingent consideration during the year ended December 31, 2021 | ( | ( | — | ||||||
Liability balance for contingent consideration at December 31, 2021 | $ | | $ | — | $ | | |||
67
TOPBUILD CORP.
NOTES TO CONSOLIDATED FINANCIAL STATEMENTS
16. SHARE REPURCHASE PROGRAMS
On July 26, 2021, our Board authorized the 2021 Repurchase Program, pursuant to which the Company may purchase up to $
On February 22, 2019, our Board authorized the 2019 Repurchase Program, pursuant to which the Company may purchase up to $
Effective November 4, 2019, under the 2019 Repurchase Program, we entered into the 2019 ASR Agreement. We paid BofA $
The following table sets forth our share repurchases under the 2019 Repurchase Program during the periods presented:
Year Ended December 31, | ||||||
| 2021 |
| 2020 | |||
Number of shares repurchased | | |||||
Share repurchase cost (in thousands) | $ | | $ | | ||
(a) The year ended December 31, 2020 includes
68
ITEM 9. CHANGES IN AND DISAGREEMENTS WITH ACCOUNTANTS ON ACCOUNTING AND FINANCIAL DISCLOSURE
None.
Item 9A. CONTROLS AND PROCEDURES
Evaluation of Disclosure Controls and Procedures
As of the end of the period covered by this Annual Report, we carried out an evaluation, under the supervision and with the participation of our principal executive officer and principal financial officer, of the effectiveness of the design and operation of our disclosure controls and procedures (as such term is defined in Rules 13a-15(e) and 15d-15(e) under the Exchange Act). Based on this evaluation, our principal executive officer and principal financial officer concluded that our disclosure controls and procedures were effective as of December 31, 2021.
In accordance with guidance issued by the SEC, companies are permitted to exclude acquisitions from their assessment of internal control over financial reporting for the first fiscal year in which the acquisition occurred. Our management’s evaluation of internal control over financial reporting excluded the internal control activities of DI, which we acquired on October 15, 2021. Excluded from management’s evaluation were total assets and total revenues of DI, a wholly-owned subsidiary, representing 9% and 5%, respectively, of the related consolidated financial statement amounts as of and for the year ended December 31, 2021. We do not anticipate that the integration of DI will result in any material changes to our internal control over financial reporting, and we plan to incorporate DI into our evaluation within one year from the date of acquisition. As the post-closing integration progresses, we will continue to review, and as appropriate to integrate, DI’s internal controls and processes. We have included the financial results of DI in the consolidated financial statements from the date of acquisition.
Management’s Report on Internal Control over Financial Reporting
The management of the Company is responsible for establishing and maintaining adequate internal control over financial reporting as defined in Rules 13a-15(f) and 15d-15(f) under the Exchange Act. The Company’s internal control over financial reporting is designed to provide reasonable assurance regarding the reliability of financial reporting and the preparation of financial statements for external purposes in accordance with GAAP. The Company’s internal control over financial reporting includes those policies and procedures that: (i) pertain to the maintenance of records that, in reasonable detail, accurately and fairly reflect the transactions and dispositions of the assets of the Company; (ii) provide reasonable assurance that transactions are recorded as necessary to permit preparation of financial statements in accordance with GAAP and that receipts and expenditures of the Company are being made only in accordance with authorizations of management and directors of the Company; and (iii) provide reasonable assurance regarding prevention or timely detection of unauthorized acquisition, use or disposition of the Company’s assets that could have a material effect on the financial statements.
Because of its inherent limitations, internal control over financial reporting may not prevent or detect misstatements. Also, projections of any evaluation of effectiveness to future periods are subject to the risk that controls may become inadequate because of changes in conditions or that the degree of compliance with the policies or procedures may deteriorate.
Management assessed the effectiveness of the Company’s internal control over financial reporting as of December 31, 2021. In making this assessment, management used the criteria set forth by the Committee of Sponsoring Organizations of the Treadway Commission in Internal Control—Integrated Framework (2013). Based on our assessment and those criteria, management concluded that the Company’s internal control over financial reporting was effective as of December 31, 2021.
The effectiveness of the Company’s internal control over financial reporting as of December 31, 2021, has been audited by PricewaterhouseCoopers LLP, an independent registered public accounting firm, as stated in their report appearing under Item 8. Financial Statements and Supplementary Data – Report of Independent Registered Public Accounting Firm.
69
Changes in Internal Control Over Financial Reporting
There was no change in the Company’s internal control over financial reporting (as such term is defined in Rules 13a-15(f) and 15d-15(f) under the Exchange Act) in the fiscal quarter ended December 31, 2021, that has materially affected, or is reasonably likely to materially affect, the Company’s internal control over financial reporting.
Item 9B. OTHER INFORMATION
None.
PART III
Item 10. DIRECTORS, EXECUTIVE OFFICERS, AND CORPORATE GOVERNANCE
For information regarding our executive officers see Item 1. Business – Executive Officers, which we incorporate herein by reference. Further information required by this item will be set forth in our definitive proxy statement for the 2022 Annual Meeting of Shareholders (“2022 Proxy Statement”) to be filed with the SEC within 120 days of the year ended December 31, 2021, and is incorporated herein by reference.
Our Board of Directors adopted a Code of Business Conduct and Ethics (the “Code”) that applies to all of our employees, officers, and directors, including our Chief Executive Officer, Chief Financial Officer, and other senior officers, in accordance with applicable rules and regulations of the SEC and the NYSE. Our Code is available on our website at https://www.topbuild.com/ESG/governance. We will disclose any amendments to or waivers of this Code for directors, executive officers, or senior officers on our website. The reference to our website address does not constitute incorporation by reference of the information contained on the website, and such information is not a part of this Annual Report.
Item 11. EXECUTIVE COMPENSATION
Information required by this item will be set forth in our 2022 Proxy Statement, and is incorporated herein by reference.
Item 12. SECURITY OWNERSHIP OF CERTAIN BENEFICIAL OWNERS AND MANAGEMENT, AND RELATED STOCKHOLDER MATTERS
Information required by this item will be set forth in our 2022 Proxy Statement, and is incorporated herein by reference.
Item 13. CERTAIN RELATIONSHIPS AND RELATED TRANSACTIONS, AND DIRECTOR INDEPENDENCE
Information required by this item will be set forth in our 2022 Proxy Statement, and is incorporated herein by reference.
Item 14. PRINCIPAL ACCOUNTING FEES AND SERVICE
Information required by this item will be set forth in our 2022 Proxy Statement, and is incorporated herein by reference.
70
PART IV
Item 15. EXHIBITS AND FINANCIAL STATEMENT SCHEDULES
| a. | Listing of Documents: |
| i. | Financial Statements. Our Consolidated Financial Statements included in Item 8 hereof, as required at December 31, 2021 and 2020, and for the years ended December 31, 2021, 2020, and 2019, consist of the following: |
Consolidated Balance Sheets
Consolidated Statements of Operations
Consolidated Statements of Comprehensive Income
Consolidated Statements of Cash Flows
Consolidated Statements of Changes in Equity
Notes to Consolidated Financial Statements
| ii. | Exhibits. See separate Index to Exhibits hereafter. |
Item 16. FORM 10-K SUMMARY
None.
71
INDEX TO EXHIBITS
72
|
| Incorporated by Reference | Filed | ||||||||
Exhibit No. |
| Exhibit Title |
| Form |
| Exhibit |
| Filing Date |
| Herewith | |
10.12 | 8-K | 10.1 | 4/26/2018 | ||||||||
10.13* | 10-K | 10.20 | 2/26/2019 | ||||||||
10.14† | Amendment to the TopBuild Corp. 2015 Long Term Stock Incentive Plan | 8-K | 10.1 | 2/22/2019 | |||||||
10.15† | 8-K | 10.3 | 2/22/2019 | ||||||||
10.16** | 10-K | 10.23 | 2/25/2020 | ||||||||
10.17† | 8-K | 10.1 | 1/10/2020 | ||||||||
10.18 |
| 8-K | 10.1 | 10/08/2021 | |||||||
10.19 | 8-K | 10.2 | 3/23/2020 | ||||||||
10.20† | TopBuild Corp. Executive Severance Plan, as Amended and Restated effective December 31, 2020 | 8-K | 10.1 | 12/14/2020 | |||||||
10.21 | 8-K | 10.1 | 03/11/2021 | ||||||||
10.22 | 8-K | 4.01 | 03/16/2021 | ||||||||
10.23 | Form of 3.625% Senior Note due 2029 | 8-K | 4.02 | 03/16/2021 | |||||||
10.24 | 8-K | 4.01 | 10/15/2021 | ||||||||
10.25 | 8-K | 4.02 | 10/15/2021 | ||||||||
10.26† | X | ||||||||||
10.27† | X | ||||||||||
73
|
| Incorporated by Reference | Filed | ||||||||
Exhibit No. |
| Exhibit Title |
| Form |
| Exhibit |
| Filing Date |
| Herewith | |
10.28† | Executive & Non-employee Director Stock Ownership Guidelines | X | |||||||||
21.1 | X | ||||||||||
23.1 | X | ||||||||||
31.1 | X | ||||||||||
31.2 | X | ||||||||||
32.1‡ | |||||||||||
32.2‡ | |||||||||||
101.INS | Inline XBRL Instance Document - the Instance Document does not appear in the Interactive Data File because its XBRL tags are embedded within the Inline XBRL document. | X | |||||||||
101.SCH | Inline XBRL Taxonomy Extension Schema Document | X | |||||||||
101.CAL | Inline XBRL Taxonomy Extension Calculation Linkbase Document | X | |||||||||
| |||||||||||
101.DEF |
| Inline XBRL Taxonomy Extension Definition Linkbase |
|
| X | ||||||
101.LAB | Inline XBRL Taxonomy Extension Label Linkbase Document | X | |||||||||
101.PRE | Inline XBRL Taxonomy Extension Presentation Linkbase Document | X | |||||||||
104 | Cover Page Interactive Data File (formatted as Inline XBRL and contained in Exhibit 101) | X | |||||||||
† Indicates management contract or compensatory plan, contract or arrangement.
*Confidential treatment has been granted for portions of this exhibit. The copy filed herewith omits the information subject to the confidentiality requests. Omissions are designated as [***]. A complete version of this exhibit has been filed with the SEC.
**Certain identified information has been excluded from this exhibit because it is both (i) not material and (ii) would likely cause competitive harm to the registrant if publicly disclosed. “[***]” indicates where the information has been omitted from this exhibit.
*** The schedules and exhibits to this agreement have been omitted pursuant to Item 601(c) of Regulation S-K. The Company agrees to supplementally furnish to the SEC, upon request, a copy of any omitted schedule or exhibit.
‡Furnished herewith.
74
SIGNATURES
Pursuant to the requirements of Section 13 or 15(d) of the Securities Exchange Act of 1934, the registrant has duly caused this report to be signed on its behalf by the undersigned, thereunto duly authorized.
| TOPBUILD CORP. | |
|
| |
| By: | /s/ John S. Peterson |
| Name: | John S. Peterson |
| Title: | Vice President and Chief Financial Officer |
February 22, 2022
Pursuant to the requirements of the Securities Exchange Act of 1934, this report has been signed below by the following persons on behalf of the registrant and in the capacities and on the dates indicated.
Signature | Title | Date | ||
/s/ Robert Buck | Director, Chief Executive Officer | February 22, 2022 | ||
Robert Buck | (Principal Executive Officer) | |||
/s/ John S. Peterson | Vice President, Chief Financial Officer | February 22, 2022 | ||
John S. Peterson | (Principal Financial Officer) | |||
/s/ Robert Kuhns | Vice President, Controller | February 22, 2022 | ||
Robert Kuhns | (Principal Accounting Officer) | |||
/s/ Alec C. Covington | Chairman of the Board | February 22, 2022 | ||
Alec C. Covington | ||||
/s/ Ernesto Bautista, III | Director | February 22, 2022 | ||
Ernesto Bautista, III | ||||
/s/ Carl T. Camden | Director | February 22, 2022 | ||
Carl T. Camden | ||||
/s/ Joseph S. Cantie | Director | February 22, 2022 | ||
Joseph S. Cantie | ||||
/s/ Tina M. Donikowski | Director | February 22, 2022 | ||
Tina M. Donikowski | ||||
/s/ Mark A. Petrarca | Director | February 22, 2022 | ||
Mark A. Petrarca | ||||
/s/ Nancy M. Taylor | Director | February 22, 2022 | ||
Nancy M. Taylor | ||||
75